The Graph View
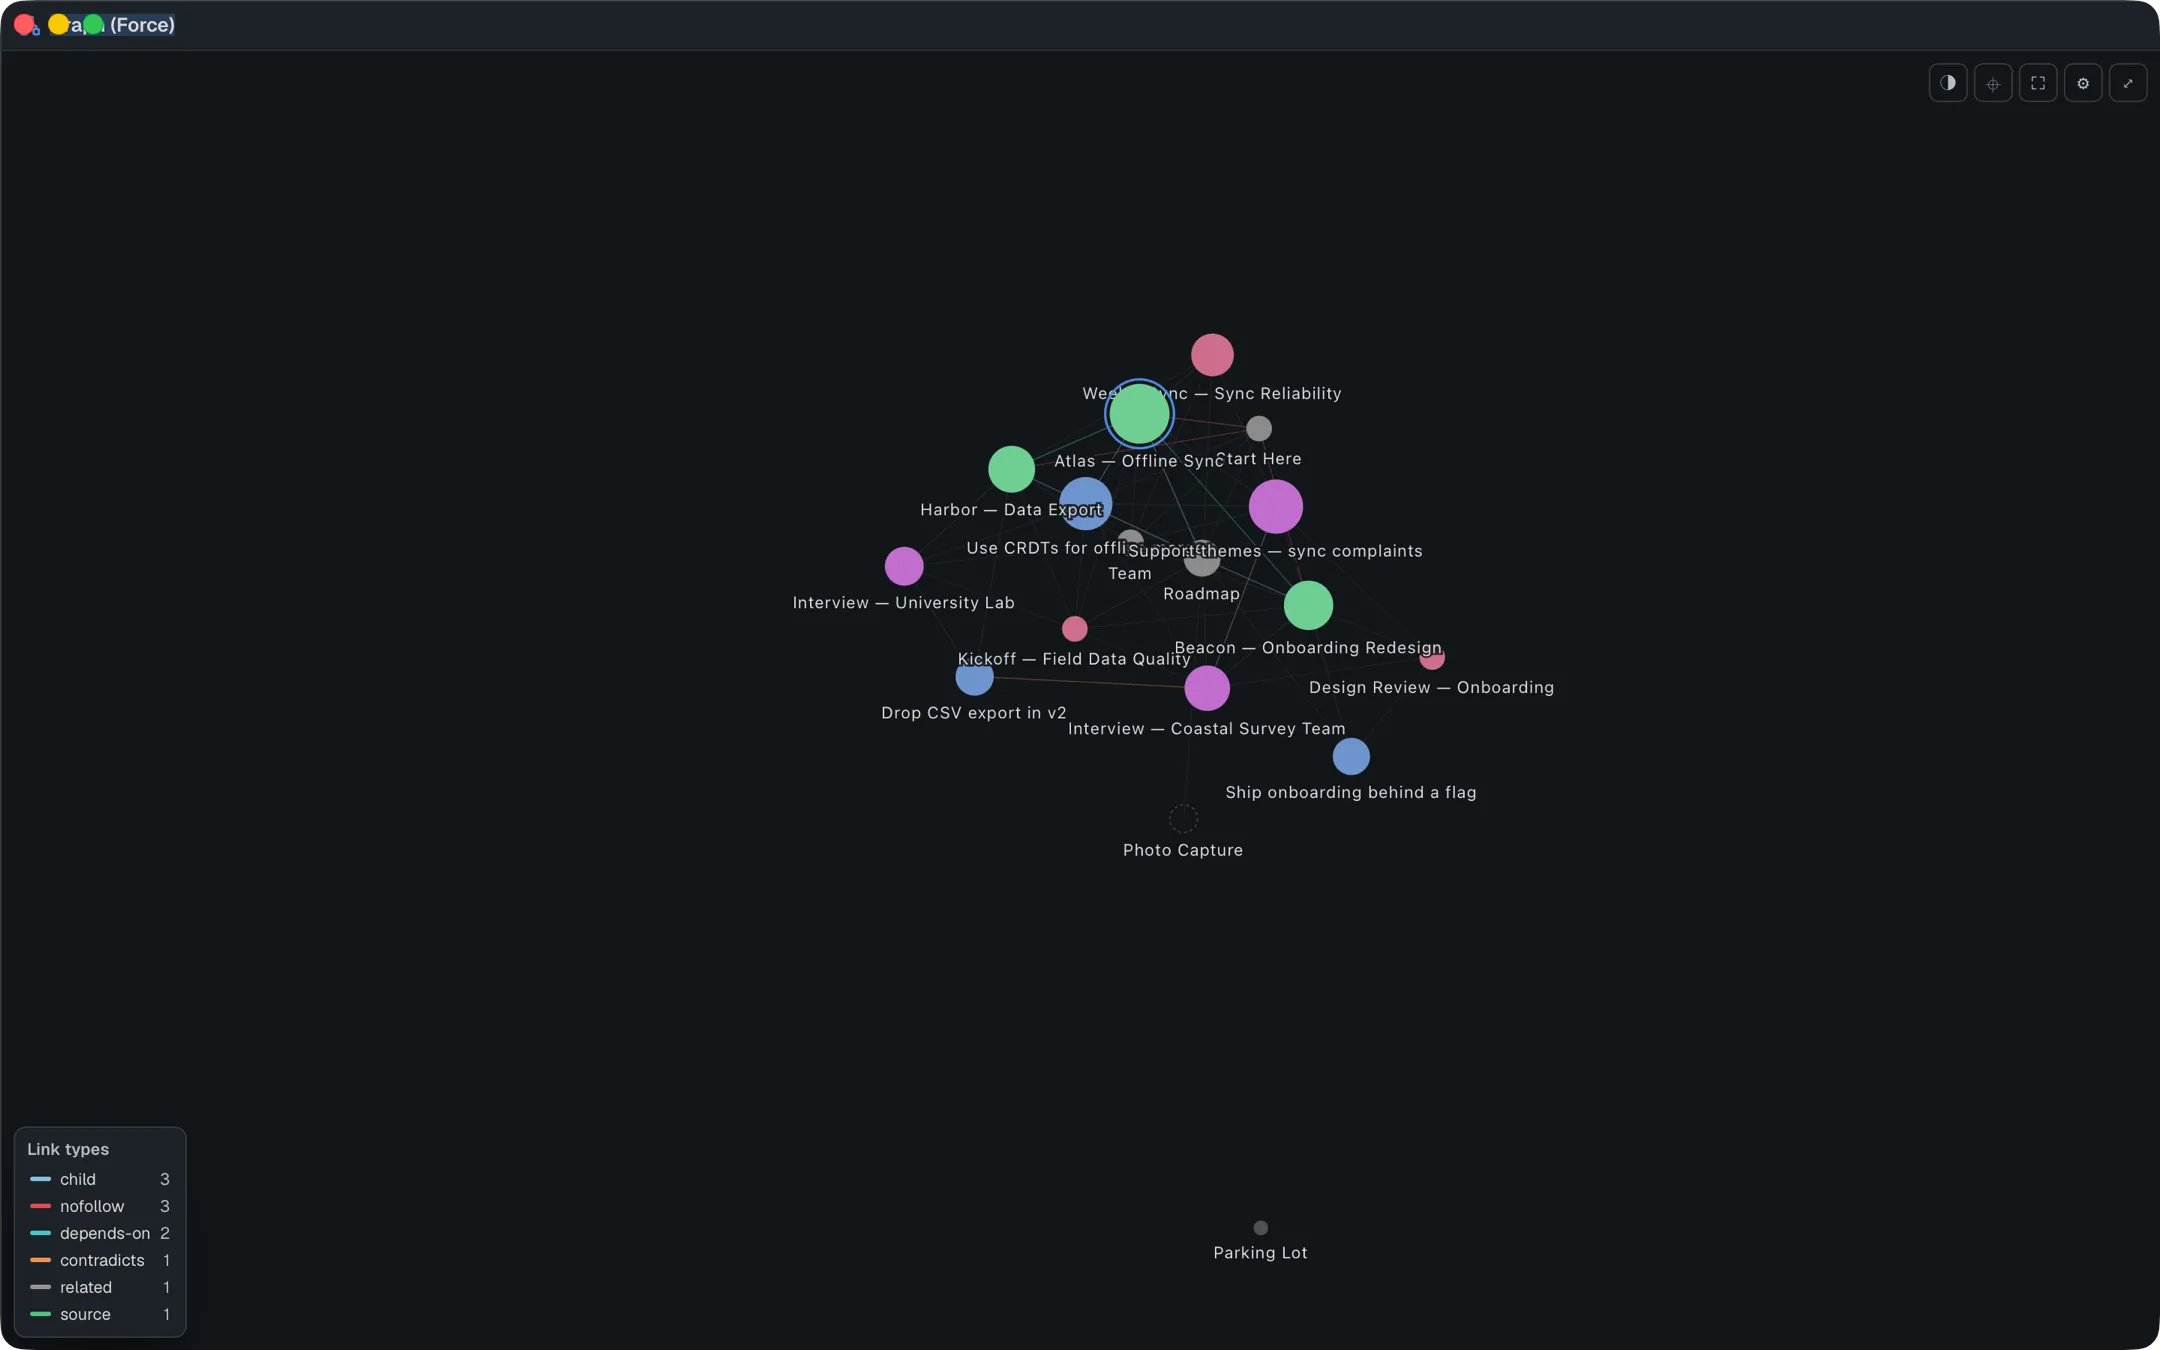
The graph is a live map of your vault: every file is a node, every link is an edge — and, when you turn them on, your tags, people and dates too. Hubs and clusters emerge from how you actually write — the more a note is linked to, the bigger it draws.
Opening it
Section titled “Opening it”Graph is a tab in the right-hand rail, marked with a network icon. It’s built into the app and always available.
To open it, press ⌘⇧G (except in <>Source, where that key means Find previous), run Open graph view from the command palette (⌘K), or click the tab. The first time a vault finishes indexing, DocGraph opens the graph on its own so you can see what you’ve got; that happens once per vault.
Tags, people and dates as nodes
Section titled “Tags, people and dates as nodes”The legend’s Show section adds layers: Tags, Mentions (people and the other kinds of @mention) and Dates draw as small squares beside your files, and Similar notes, Property edges and Co-occurrence add lines. They start switched off, so the default view is files and links only; each shows a count while on, and your choice is remembered per vault. Similar notes adds no nodes: it draws a dashed line between notes whose content is alike but that don’t link to each other — fainter for a weaker resemblance, with the similarity shown on hover (“Similar · 68%”). It fills in once AI search has indexed the vault, and follows your edits. Property edges draws a property whose key has a range in the ontology — owner: Sam, project: Apollo — as an edge from the note to what it names: the project note, the same person node the Mentions layer draws, or a new square for something with no page. Hovering the edge shows the key. A property on a single line (a block property such as owner, or a todo’s @name) draws an edge from that line’s page too; clicking that edge opens the page scrolled to the line. Co-occurrence draws a dotted line between two notes that share a person, a tag or a day, with what they share on hover (“Shared: Sam, #ops”).
Clicking an entity pins its neighbourhood rather than opening a file — it is a lens, not a destination. Click a person, tag or day twice quickly to open it: the person’s page (or the Mentions panel), the Tags panel on that tag, or the Calendar on that day. A layer with more than 500 nodes draws its 200 best-connected ones, and its count reads 200 of N.
Search, filter and orphans
Section titled “Search, filter and orphans”The search box at the left of the toolbar finds notes by name as you type — loosely, so zcov finds zephyr-cache-overview — lighting the matches and dimming the rest. Press Return to fly to the best match, Esc to clear. Some words narrow the view instead of lighting it: folder:projects/alpha keeps only that folder’s notes, tag:ops only notes tagged ops, and prop:status=active only notes whose status property is active (prop:status keeps every note that has one). Several values of one kind widen the filter; different kinds narrow it. Entities stay when a note they touch stays.
The ◌ button cycles how orphans (notes with no links at all) appear: dimmed (the default), shown at full strength, hidden, or orphans only — the “what have I left disconnected?” view.
Saved views
Section titled “Saved views”A filter you keep coming back to can be kept under a name. The ☰ button beside the search box opens Saved views: type a name and Save, and the view is stored as it is now: the search, the orphan mode, the layers you turned on, hidden link types, the colour mode, Size by, the time range, notes you hid and local mode. The list says what each view keeps beyond the search. Click a saved view to put it all back; the ✕ on its row deletes it. Saving under a name you already used replaces that view; you can keep up to 24. While the graph shows exactly a saved view, the button lights up and its tooltip names it. Views are remembered per vault.
Paths between notes
Section titled “Paths between notes”Shift-click two notes to select them, then choose Path on the chip that appears: the shortest chain of links between them lights up (up to six hops, following links in either direction), and the legend shows the hop count. If they aren’t connected within six hops, the legend says so. Clear it with the ✕ on that row.
Keeping a path in a note
Section titled “Keeping a path in a note”A path can go into a page as a live list. While a path is showing, either:
- click ⧉ on the legend’s Path row to copy it as a marker you can paste into a page’s source, or
- type /path in any HTML note and pick Graph path: A → B to insert it where the caret is. The command only appears while a path is showing.
The page then lists the notes from one end to the other, in order, with the link type that joins each one to the one before (← when that link points backwards). It’s worked out again every time the page is shown, so if you add a shortcut between the two notes, the list gets shorter. If they stop being connected, it says “No path within 6 hops.” The marker is plain HTML:
<div data-docgraph-graph-query='{"path":["notes/a.html","notes/b.html"]}'></div>You can add "direction": "out" to follow links only as written, "rel": ["depends-on"] to walk only links of that type, and "title" to change the heading. Markdown notes can’t hold this marker. The marker also does more than paths; see Live link lists in a page.
Live link lists in a page
Section titled “Live link lists in a page”The same data-docgraph-graph-query marker can list a note’s neighbourhood instead of a path, so a page can show its own backlinks, everything a hub note points to, or every note with a tag. It is plain HTML with a JSON spec in the attribute, recomputed from the live link graph each time the page is shown:
<div data-docgraph-graph-query='{"seed":"notes/x.html","depth":2,"direction":"both","rel":["source"],"title":"Around X"}'></div>Every field is optional. An empty marker lists the direct neighbours of the page it sits on.
| Field | Meaning |
|---|---|
seed | Vault-relative path to start from. Leave it out and the page itself is the seed, so one spec reads correctly wherever you paste it |
direction | "in" (pages linking to the seed, a backlinks list), "out" (pages it links to) or "both" (the default) |
depth | How many hops out, 1 to 3. Default 1 |
rel | Only follow links of these types, e.g. ["depends-on"]. Leave it out for every link |
where | Keep only pages whose properties match, e.g. {"status":"active"} |
tags | Keep only pages carrying one of these tags (with a seed, it narrows the neighbourhood). With no seed this stops being a graph walk and lists every page in the vault with the tag |
tagMatch | "any" (the default) or "all", for when tags has more than one |
limit | Most rows to show. Default 50, at most 200 |
title | The heading. The default depends on direction (“Pages linking here”, “Linked pages”, “Connected pages”), or “Tagged #x” for a tag-only list |
render | "graph" draws the result as a small radial diagram (the seed in the middle, one ring per hop) instead of a list. It is ignored for a tag-only list, which has no centre |
path | Two pages, for the shortest-path form described above. rel and direction still apply; the neighbourhood fields don’t |
transitive | true follows only the rel links, as far as they go (up to 10 hops), and stops at loops — “everything that depends-on X, and everything that depends on, and so on”. Needs rel. The direction then defaults to "out" |
type | Keep only pages of this note type, or a type built on it |
folder | Keep only pages in this folder |
via | {"rel": "source", "to": "papers/spec.html"} keeps only pages that also link to that page with that link type |
For example, a backlinks list on any page, limited to active notes:
<div data-docgraph-graph-query='{"direction":"in","where":{"status":"active"},"title":"Active pages linking here"}'></div>If nothing matches, the page shows an empty-state line rather than a blank. A spec that isn’t valid JSON shows an error in place of the list.
A walk as a table, chart or board
Section titled “A walk as a table, chart or board”To sort, filter, count or chart what a walk reaches, make it a saved query instead: in the Tables panel choose New under Saved queries, pick Graph as the source, and set where it starts, which links it follows, which way and how far. Keep only some of the pages reached… adds the type, folder and second-link conditions. Leave Start at empty and the walk starts at whatever page the query is placed in. Each page reached is a row with its Hops, the link type that reached it, and Via — the whole chain of link types from the start, such as depends-on → depends-on. Filters, sorting, grouping and charts then work on those rows like any other query.
Focusing on a query
Section titled “Focusing on a query”A saved query can be opened straight into the graph (“Open as graph”), which focuses the view on just those rows and shows a chip naming what you are looking at. Clear the chip to get the whole vault back.
Reading the graph
Section titled “Reading the graph”- Node size reflects each note’s importance in the vault (PageRank over your links) — a note many others point to draws larger than one nobody links to.
- Node color groups notes by folder by default.
- Orphans — notes with no links in or out — draw at reduced opacity so they’re easy to spot without being hidden.
- The open note has a ring around it, and a pinned node a small pip.
- Locked notes (encrypted ones you haven’t unlocked) show a padlock and have no edges, since their links can’t be read.
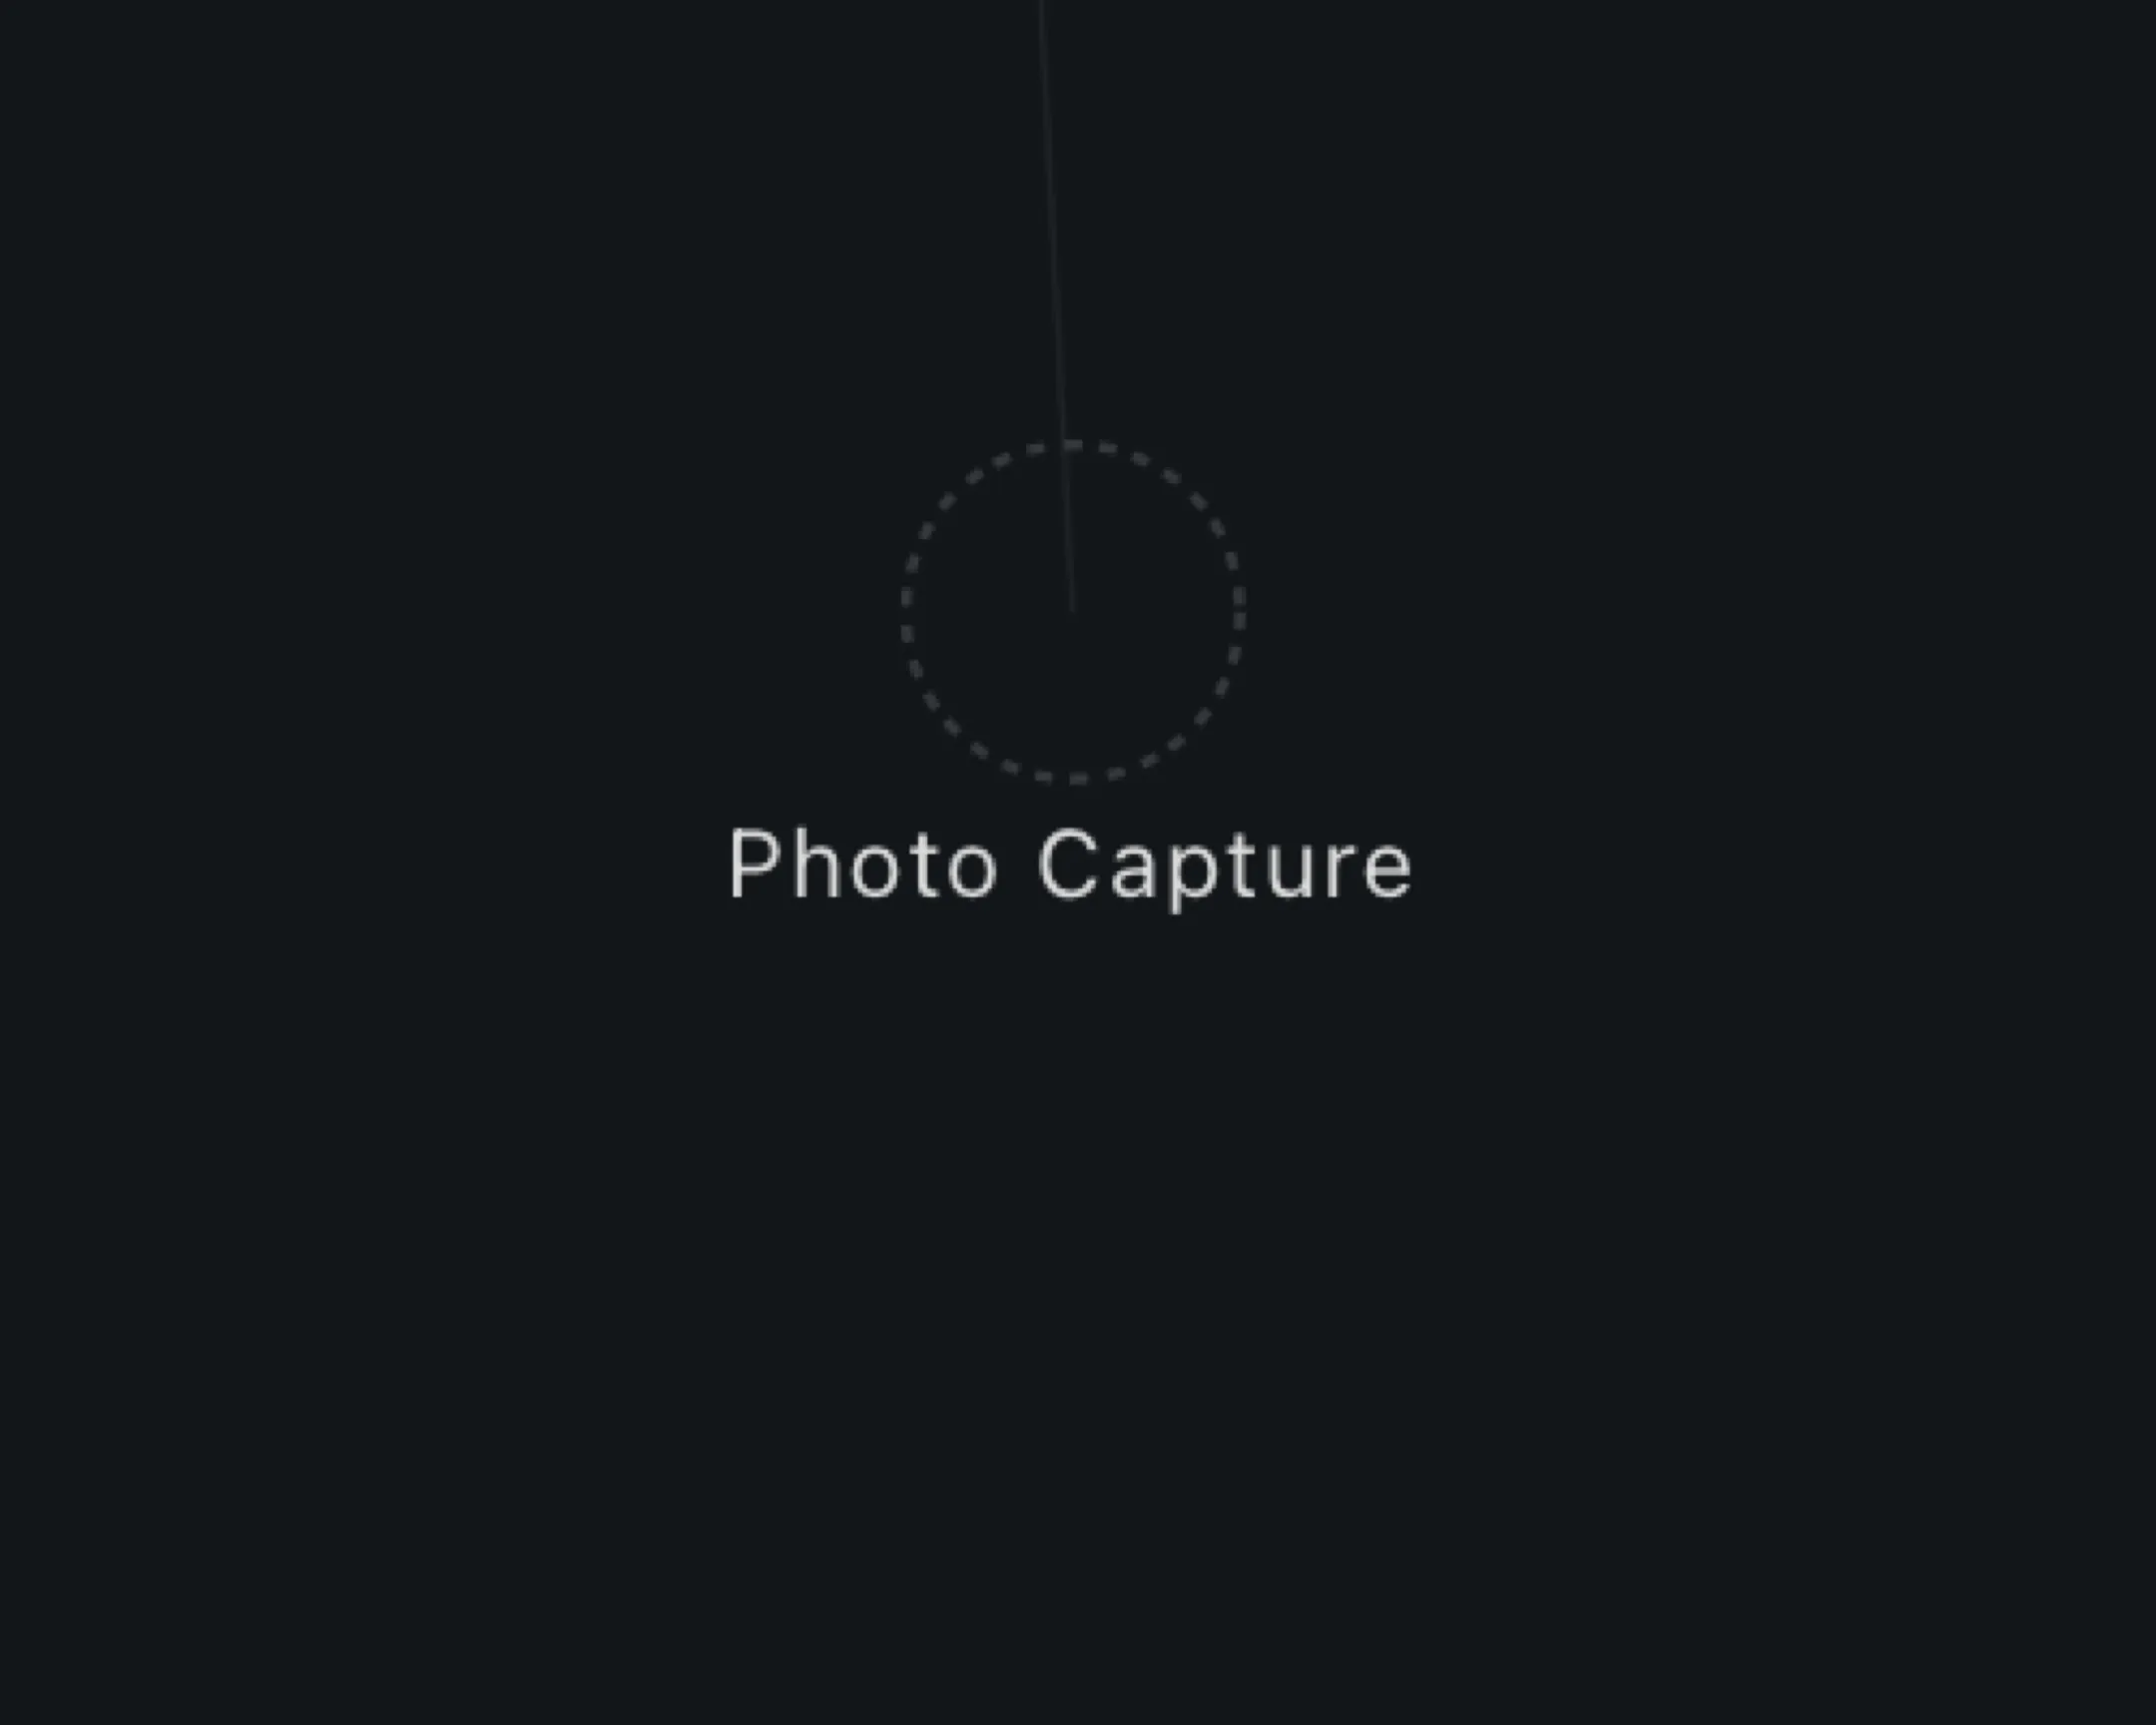
- Broken links show as a small hollow, dashed circle: a link exists to a file that doesn’t. It isn’t clickable, but it’s a visible prompt to fix the link or create the note.
Typed links and the legend
Section titled “Typed links and the legend”Plain links draw as a neutral line. If you type a relationship on a link — rel="depends-on", rel="source", rel="child", and so on, or {rel=depends-on} after a link in a Markdown note (how) — DocGraph colors that edge and adds it to a Link types legend in the bottom-left corner, with a count for each type currently on screen.
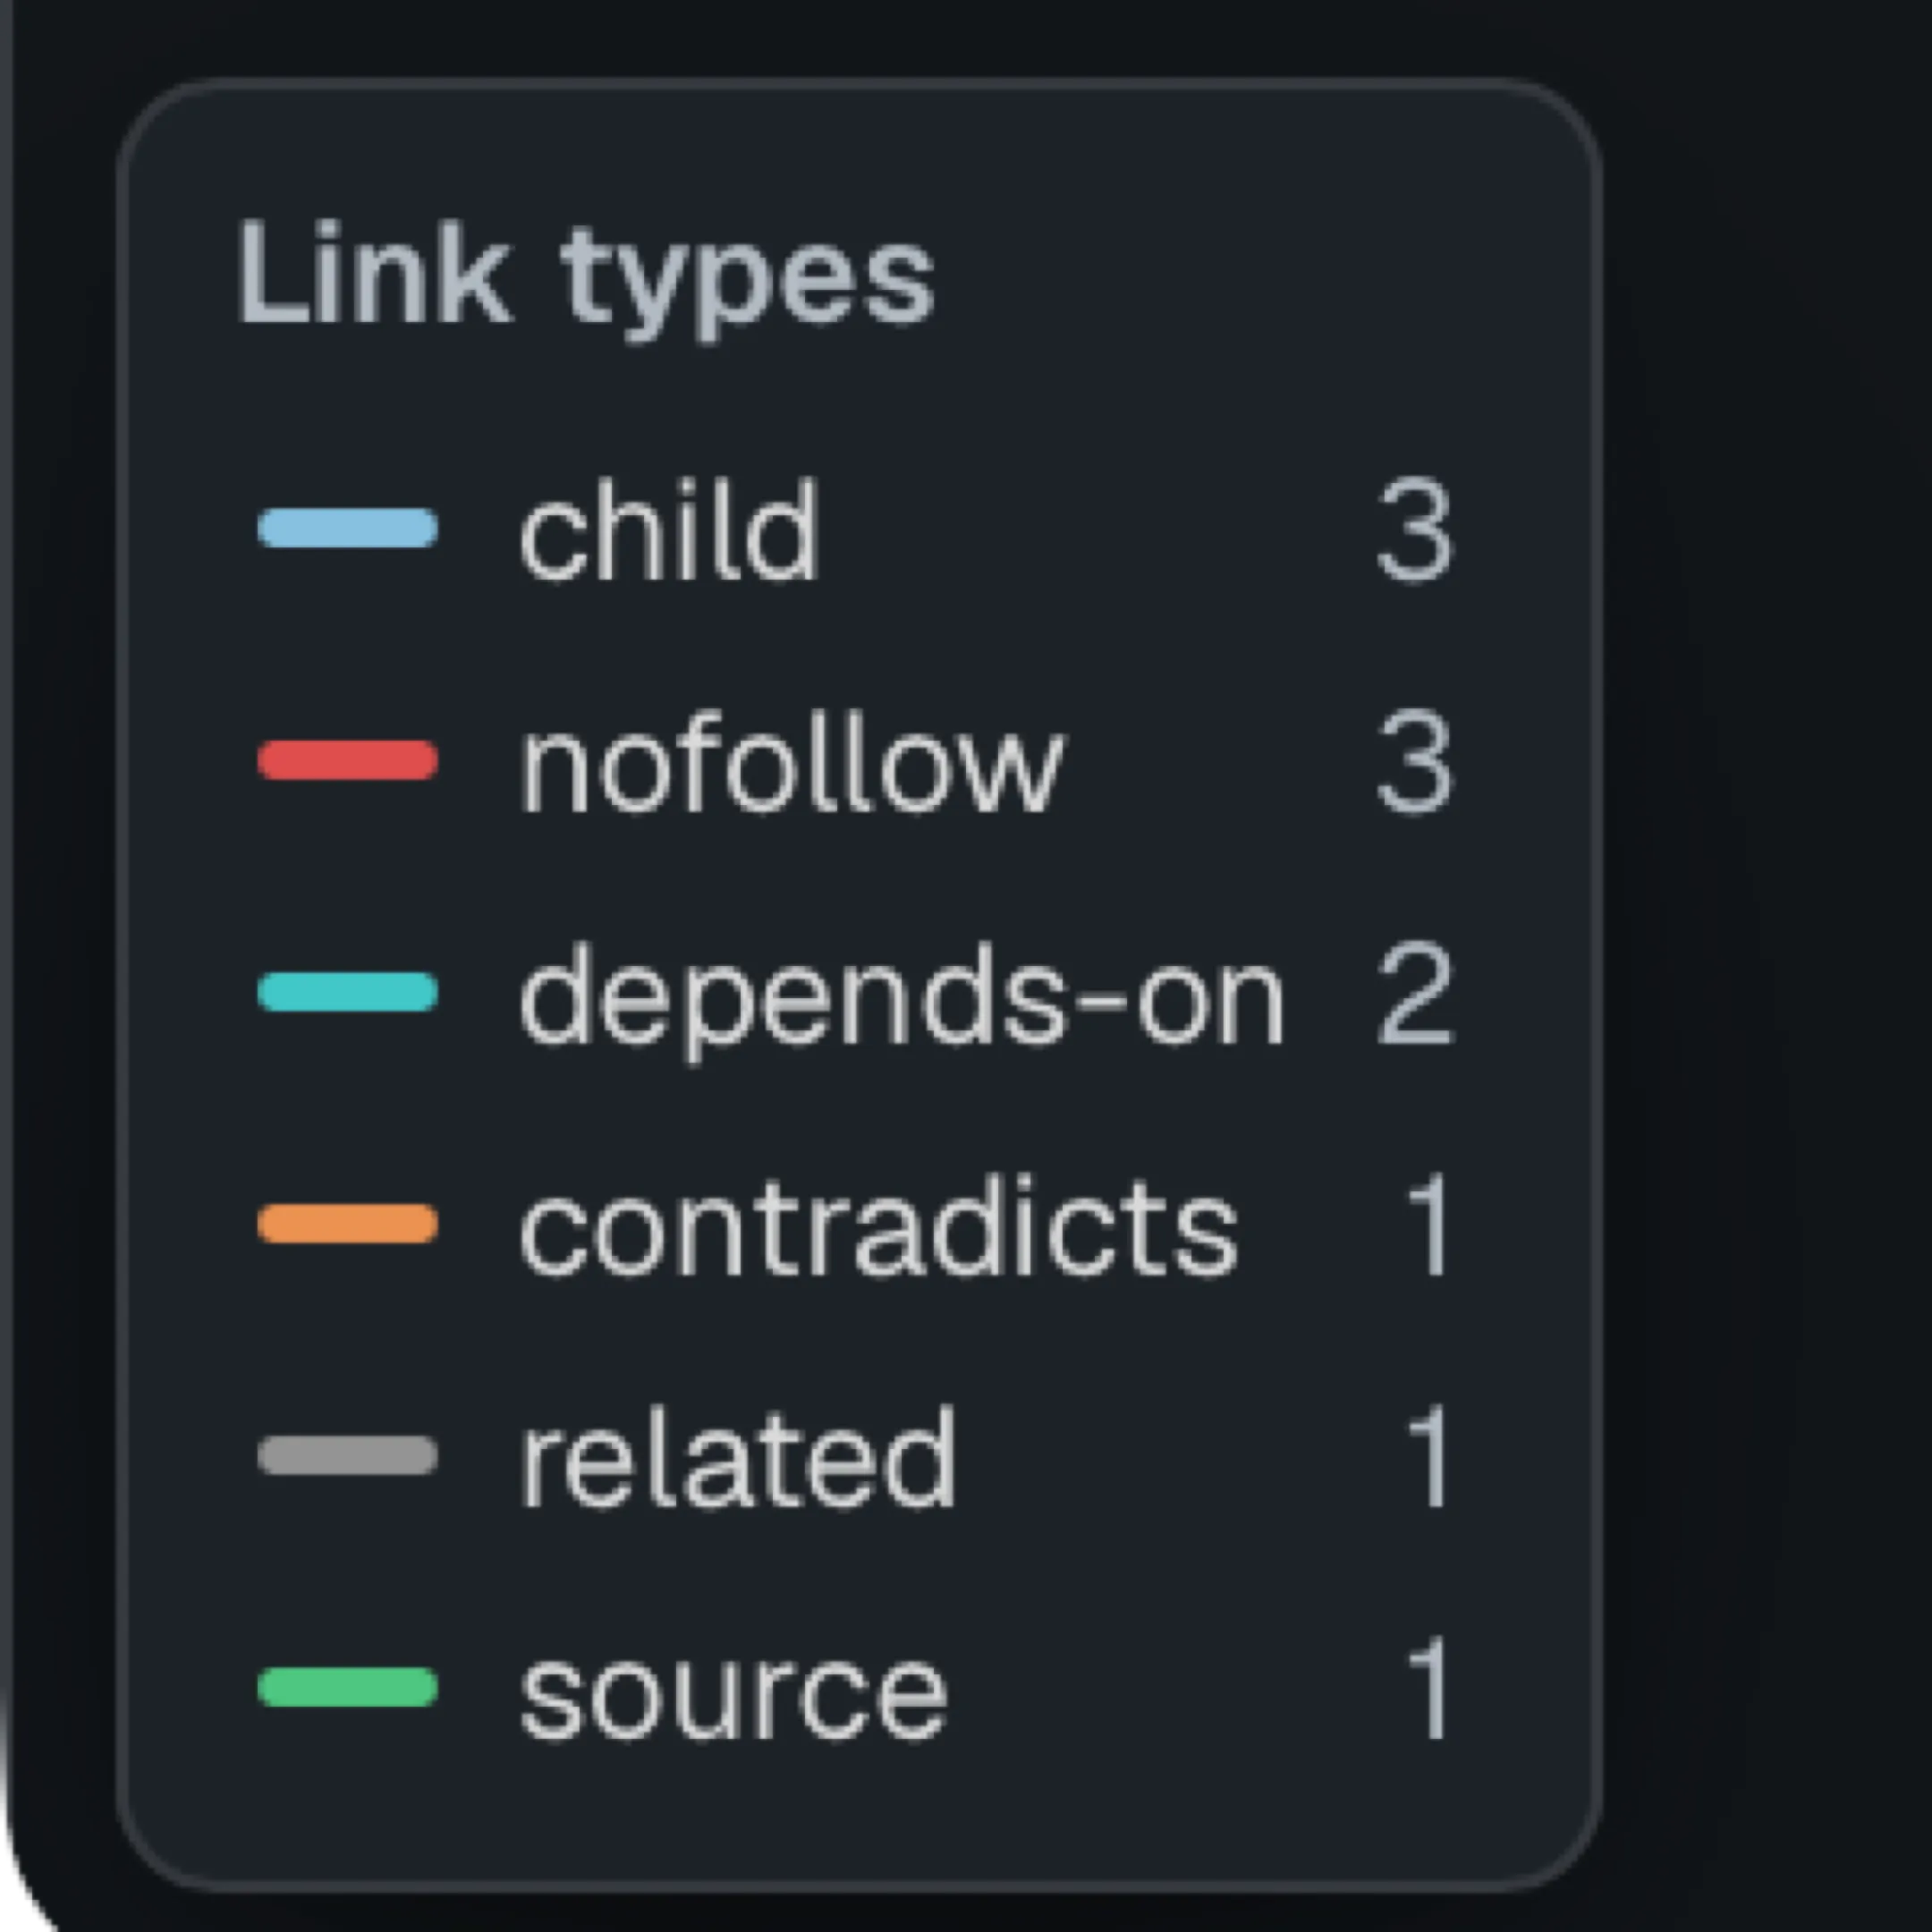
Every legend row is also a filter. Click one to hide that relationship type; click again to bring it back. A hidden type stays listed, struck through, so you always know it’s off rather than absent.
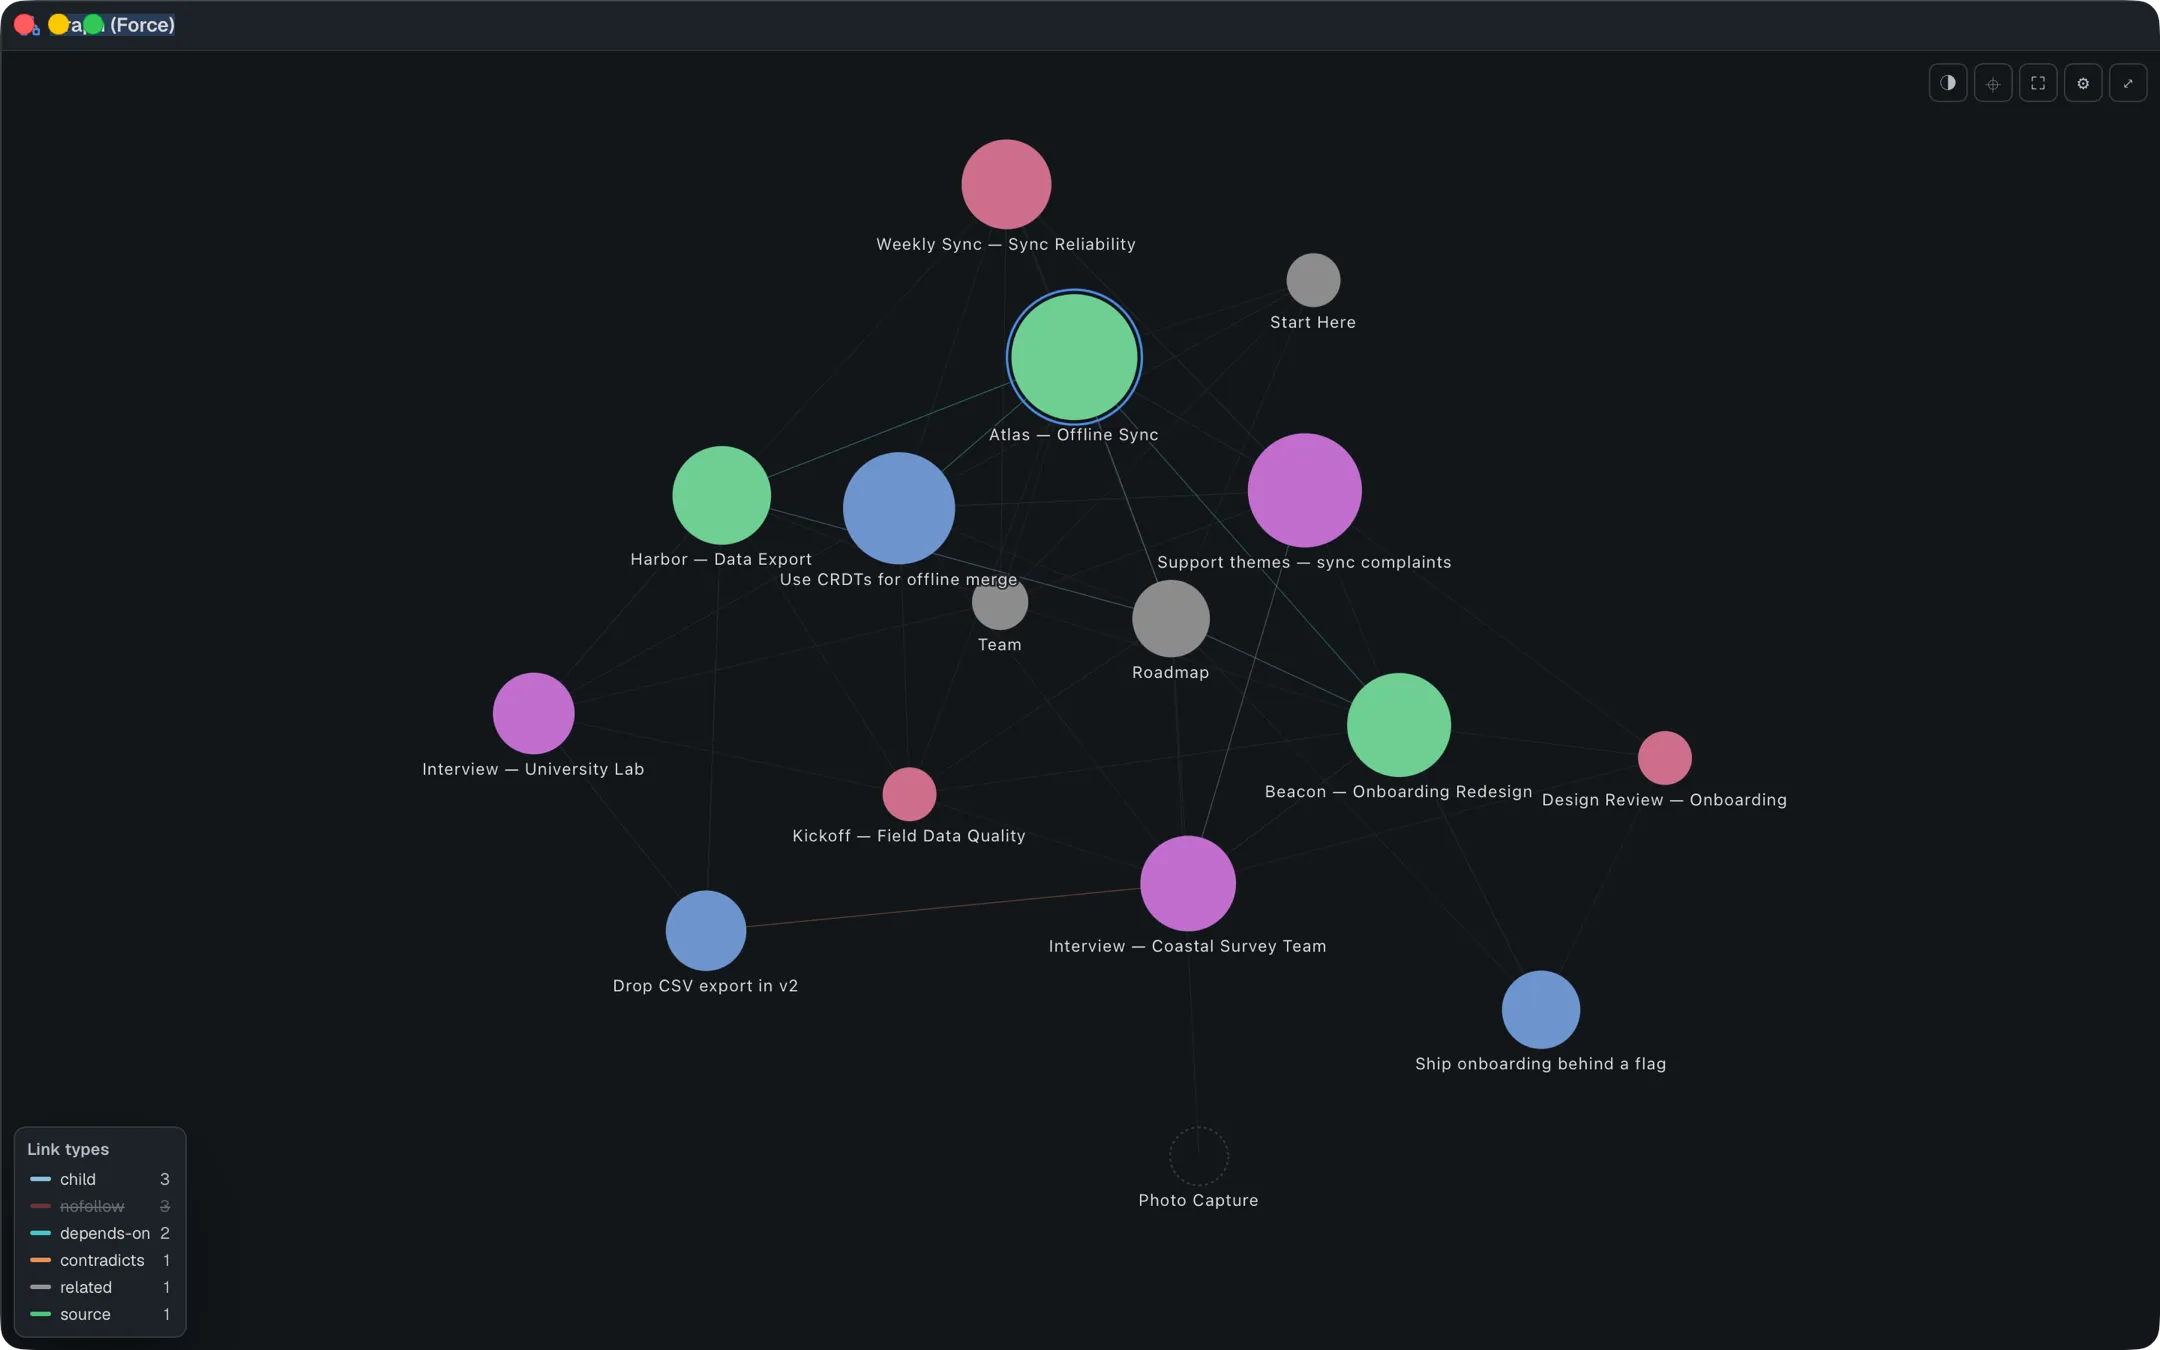
Filtering hides edges only — it never removes a note from the graph, even if every link on it happens to be the type you just turned off. A few relationship words are worth knowing:
relatedandtagshare one neutral color rather than getting their own — they’re treated as low-signal, catch-all connections.nofollowis drawn in red — DocGraph’s convention for a link you’ve marked as chrome (a “back to index” nav link, say) rather than a real connection.- Anything else you type as a
relstill gets its own color and its own legend row.
Which way a link points
Section titled “Which way a link points”A small arrowhead at the linked-to end shows a link’s direction. To keep the whole-vault view calm, arrowheads appear on the links of the note you point at, in local mode, and once you zoom in past 1.5×. Two notes that link to each other get a head at both ends.
Several links between the same two notes, in either direction and of any type, draw as one line in the first type’s colour. Each extra type adds a small tick at the middle of the line, and pointing at it lists them all (“depends-on · mentions · link”).
See what changed when
Section titled “See what changed when”The ⏱ button opens a time bar. Pick Day, Week, Month or Year to keep notes changed in that last stretch at full strength, or drag the from/to sliders for any range; All turns it off. Notes changed outside the range are drawn faint and their links dim, while tags, people and dates stay.
▶ Replay grows the range from your oldest note, a month per second, so you can watch the vault build up. With Reduce Motion on, each press steps one month.
Local mode: one note’s neighborhood
Section titled “Local mode: one note’s neighborhood”Staring at the whole vault at once isn’t always useful. The ⌖ button switches to local mode, which redraws just the active file and whoever it’s directly connected to — the file you had open gets a highlighted ring so you can find it again.
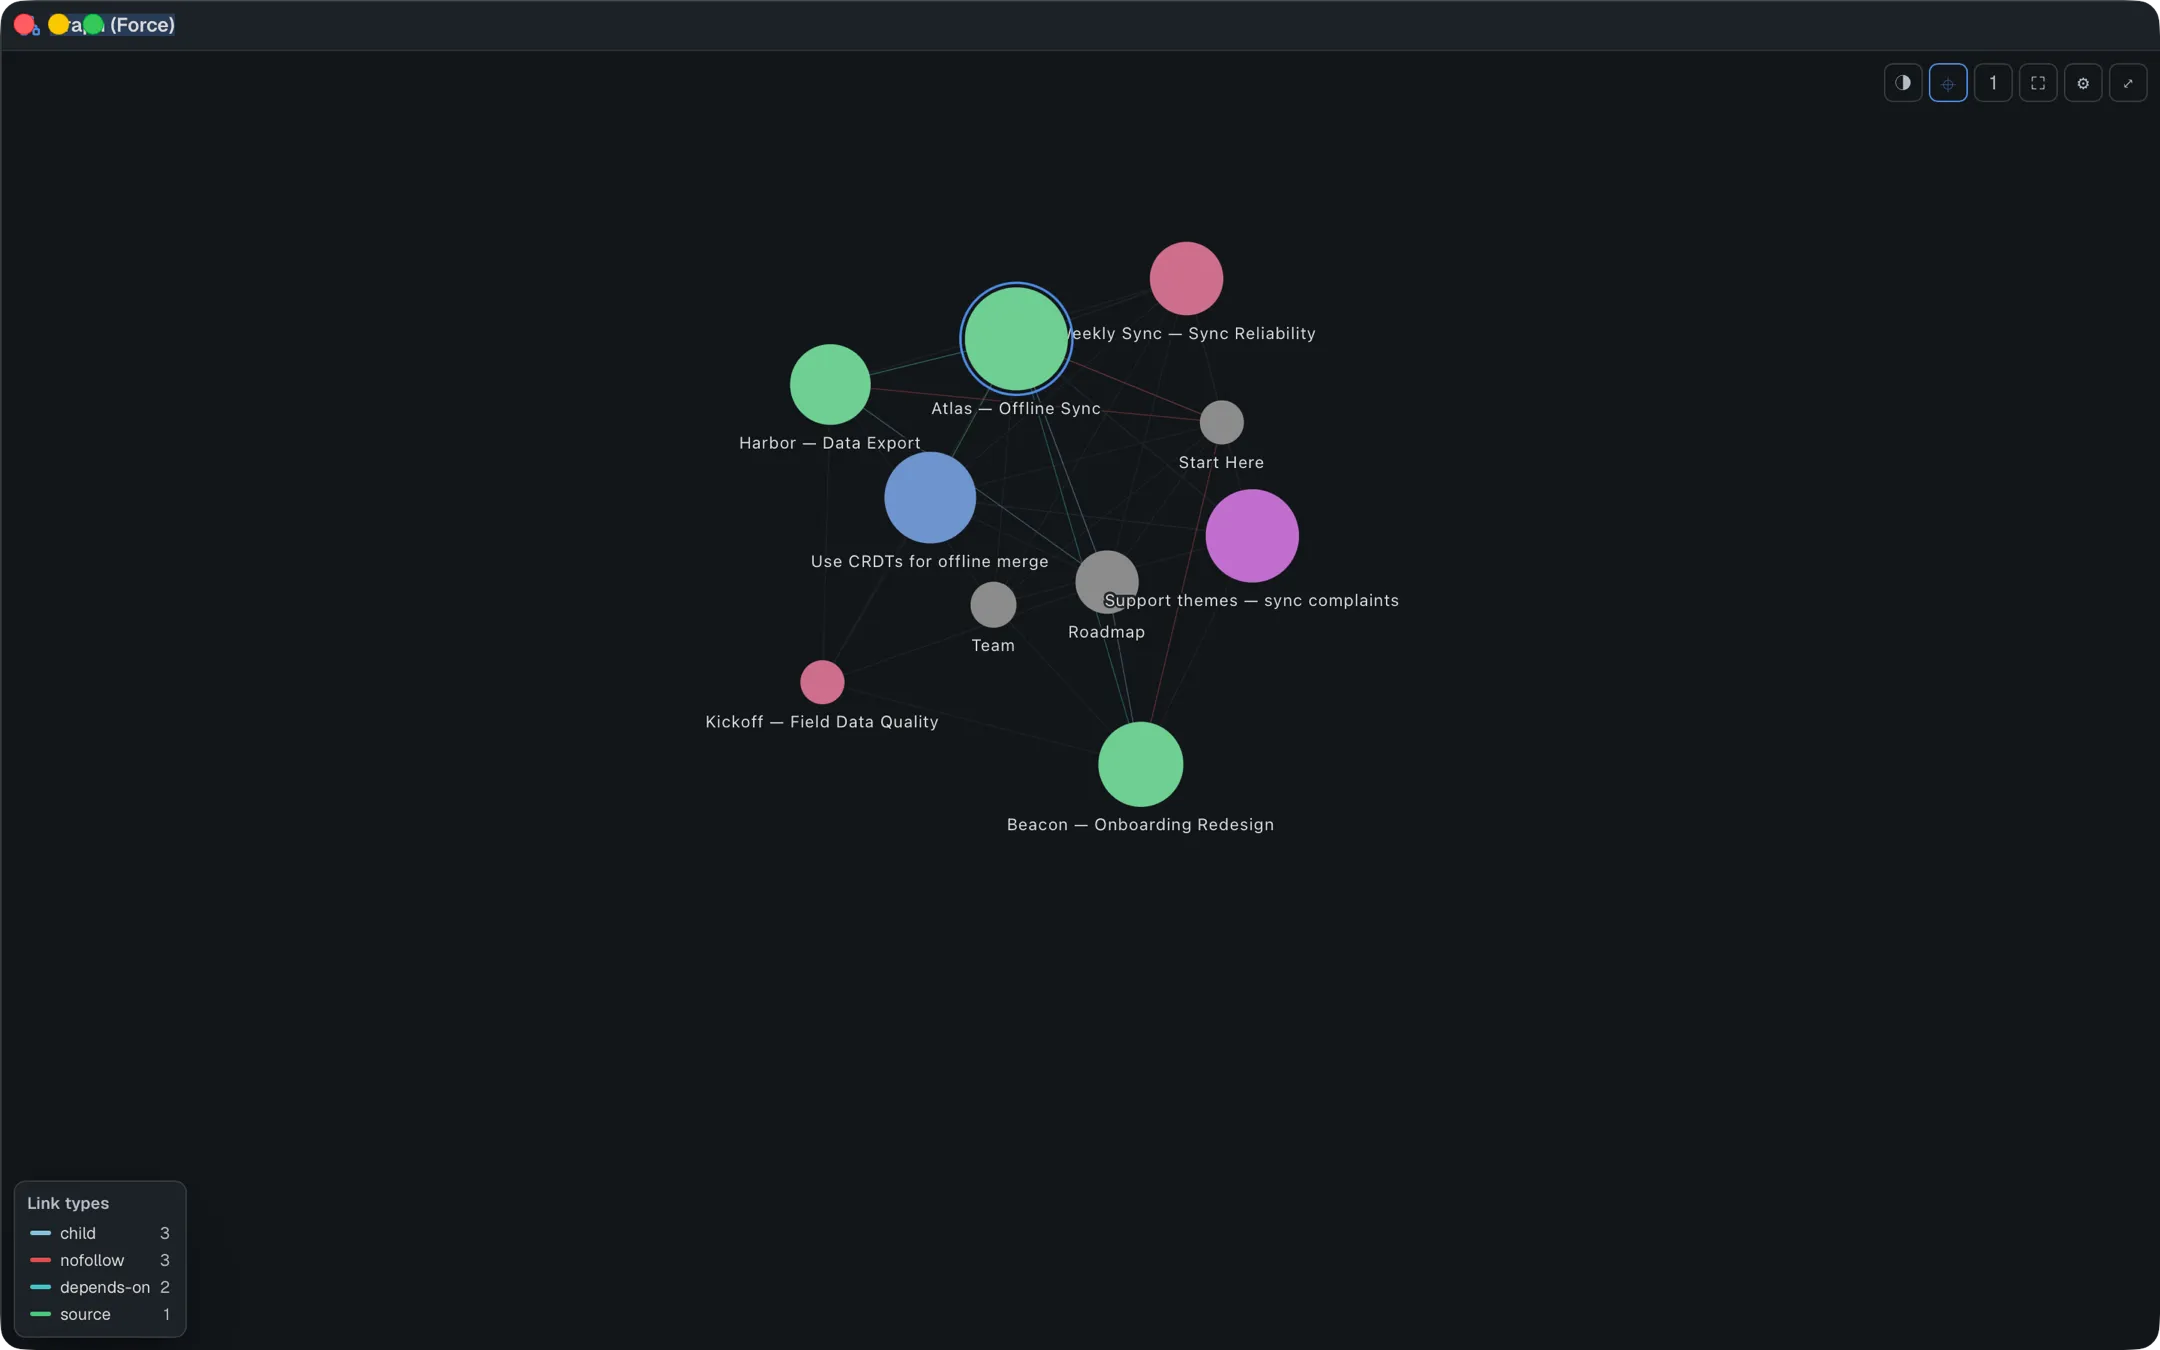
Next to it, a numbered button cycles how many hops out to show — 1, 2, or 3. One hop is direct links only; each additional hop pulls in another ring of neighbors. Local mode re-centers automatically whenever you open a different file.
Color by folder, tag, topic or property
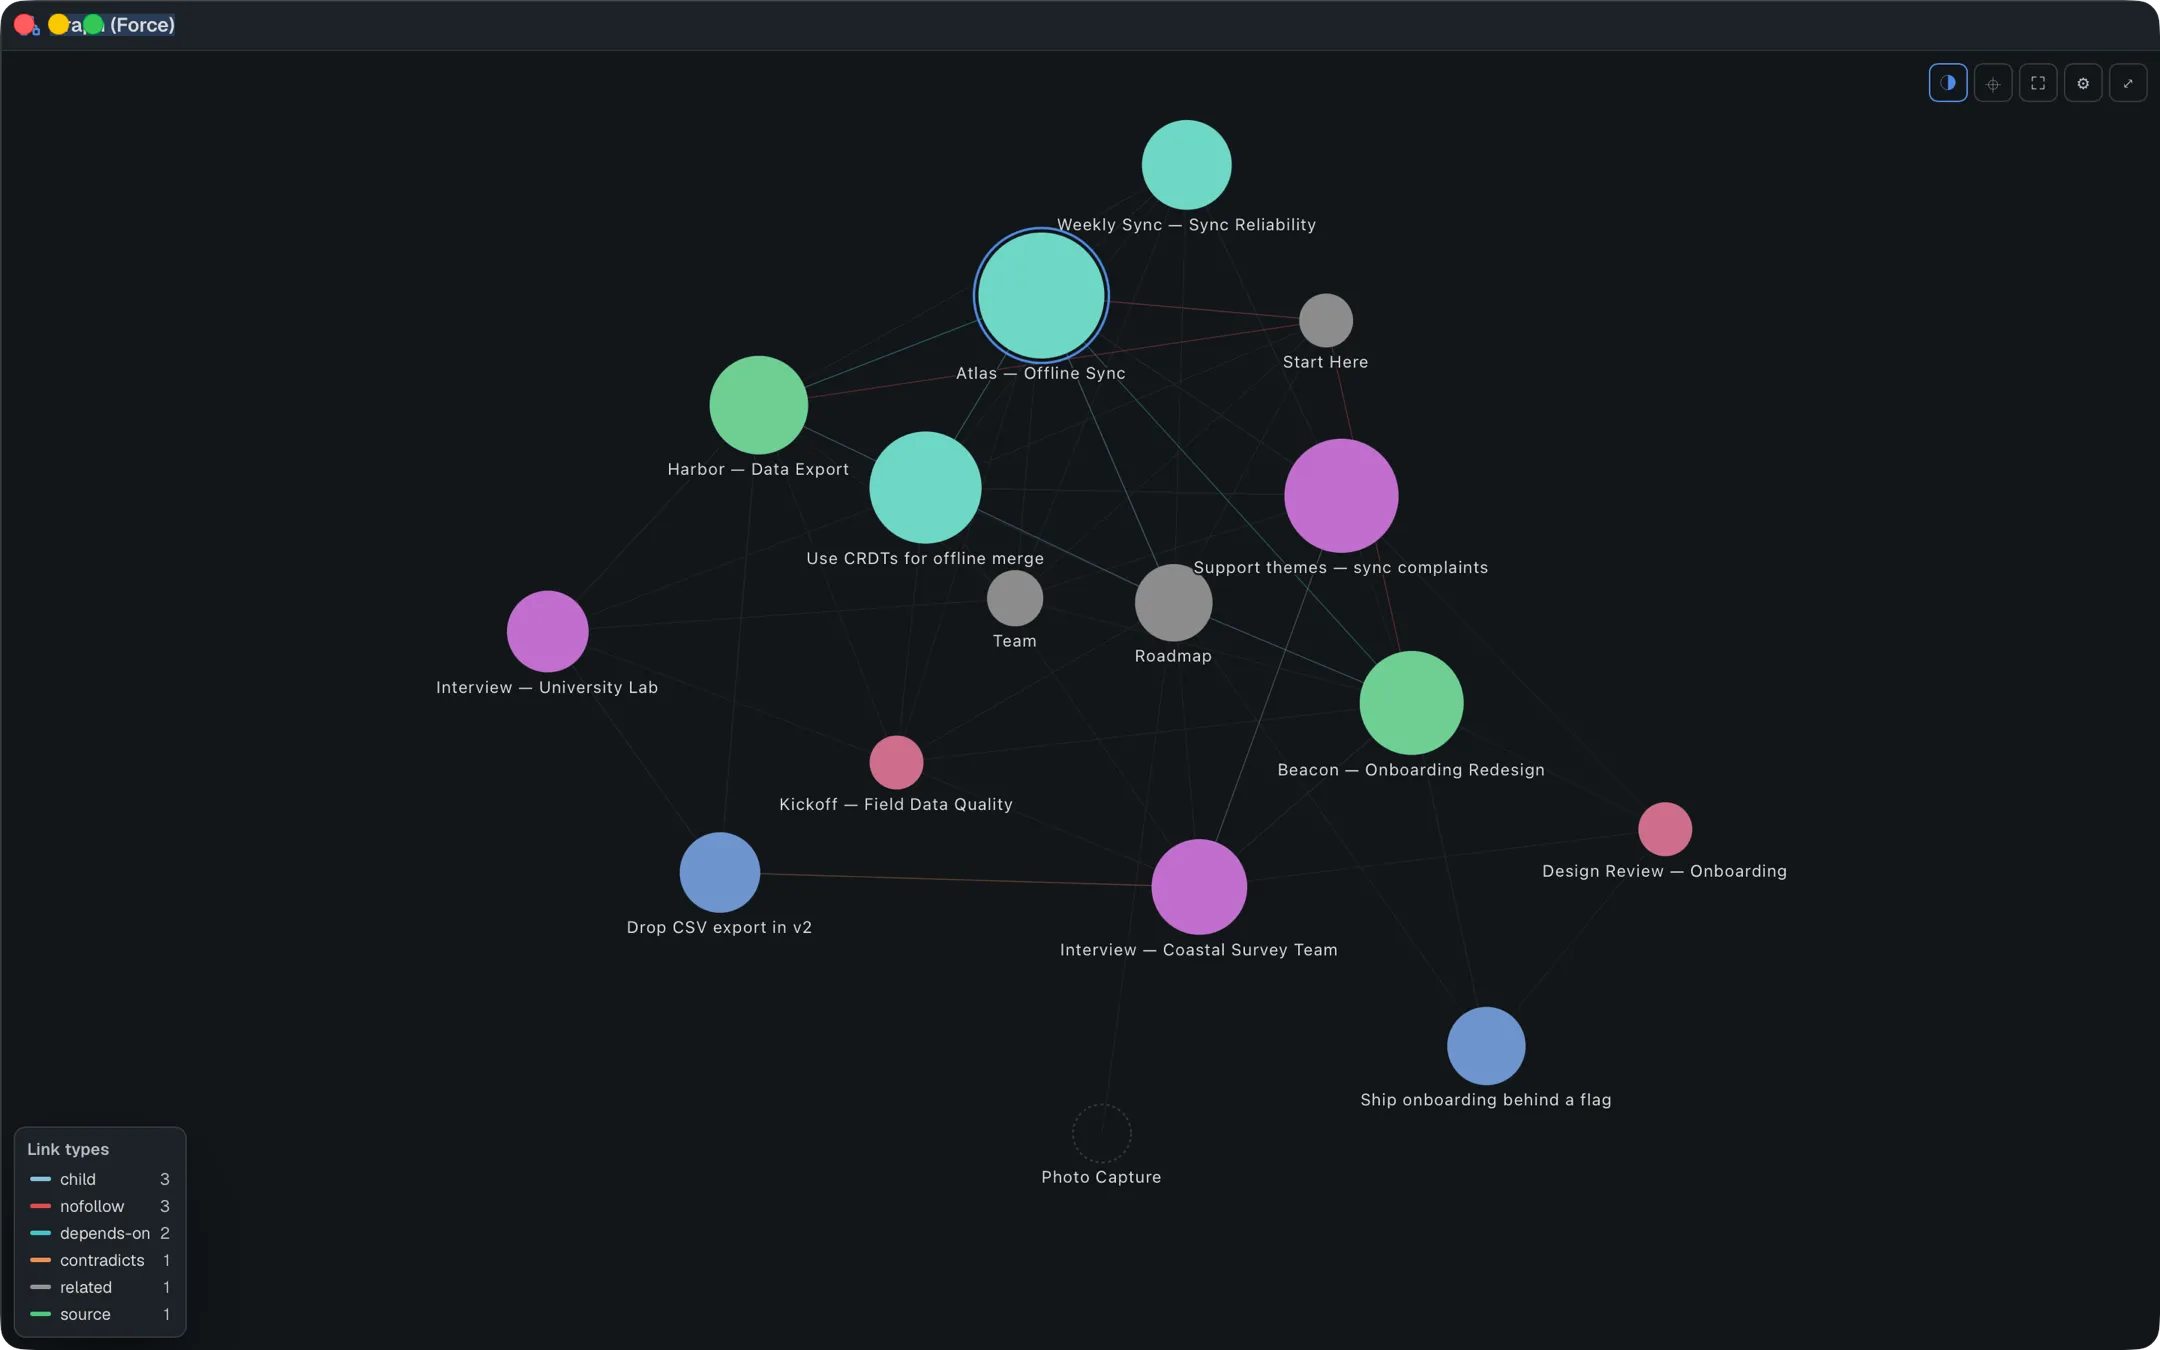
Section titled “Color by folder, tag, topic or property”The half-circle button on the left of the toolbar cycles node color through folder, tag, topic and property. Folder is the default; tag mode is most useful when a #hashtag cuts across folders — every note carrying it lights up the same color, wherever it lives. In property mode a picker appears beside the button: choose a key such as status, and each value gets its own colour while notes without the property are muted. The colour mode resets to folder when you reopen the app, unless a saved view keeps it.
Topics
Section titled “Topics”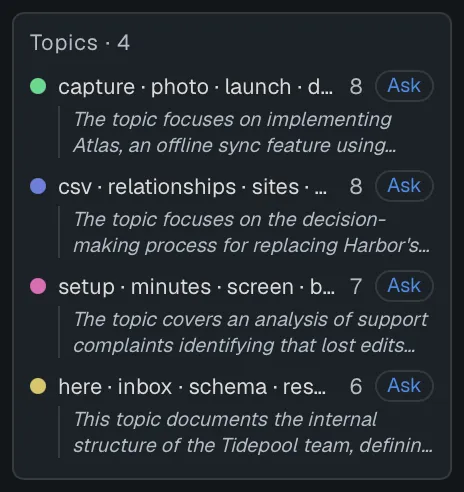
In topic mode each note is colored by the topic — the cluster of closely connected notes — it belongs to, found from its links, the people, tags and days it shares with other notes, and similar-meaning notes. A Topics key appears in the bottom-right corner, largest first. Each topic is named by the five words that set its notes apart from the rest of the vault — worked out from the text, no AI involved — so a name reads like kafka · consumer · partition · rebalance · lag.
- Click a topic to show only its notes; click it again to show everything.
- Ask on a row opens Chat with that topic’s notes attached, the same as selecting them by hand.
- With Topic summaries on (Settings → AI → Chat & index, under Vault topics; needs AI), a short AI summary of the topic appears under its row once it has been written; hover the row for all of it. It is what a whole-vault question reads.
A group of fewer than three notes is not a topic, and notes in no topic are drawn muted. Topics are recomputed whenever the links change, and they are also available to saved queries as the Files source’s Cluster column and to the assistant, which can search within one topic.
Physics
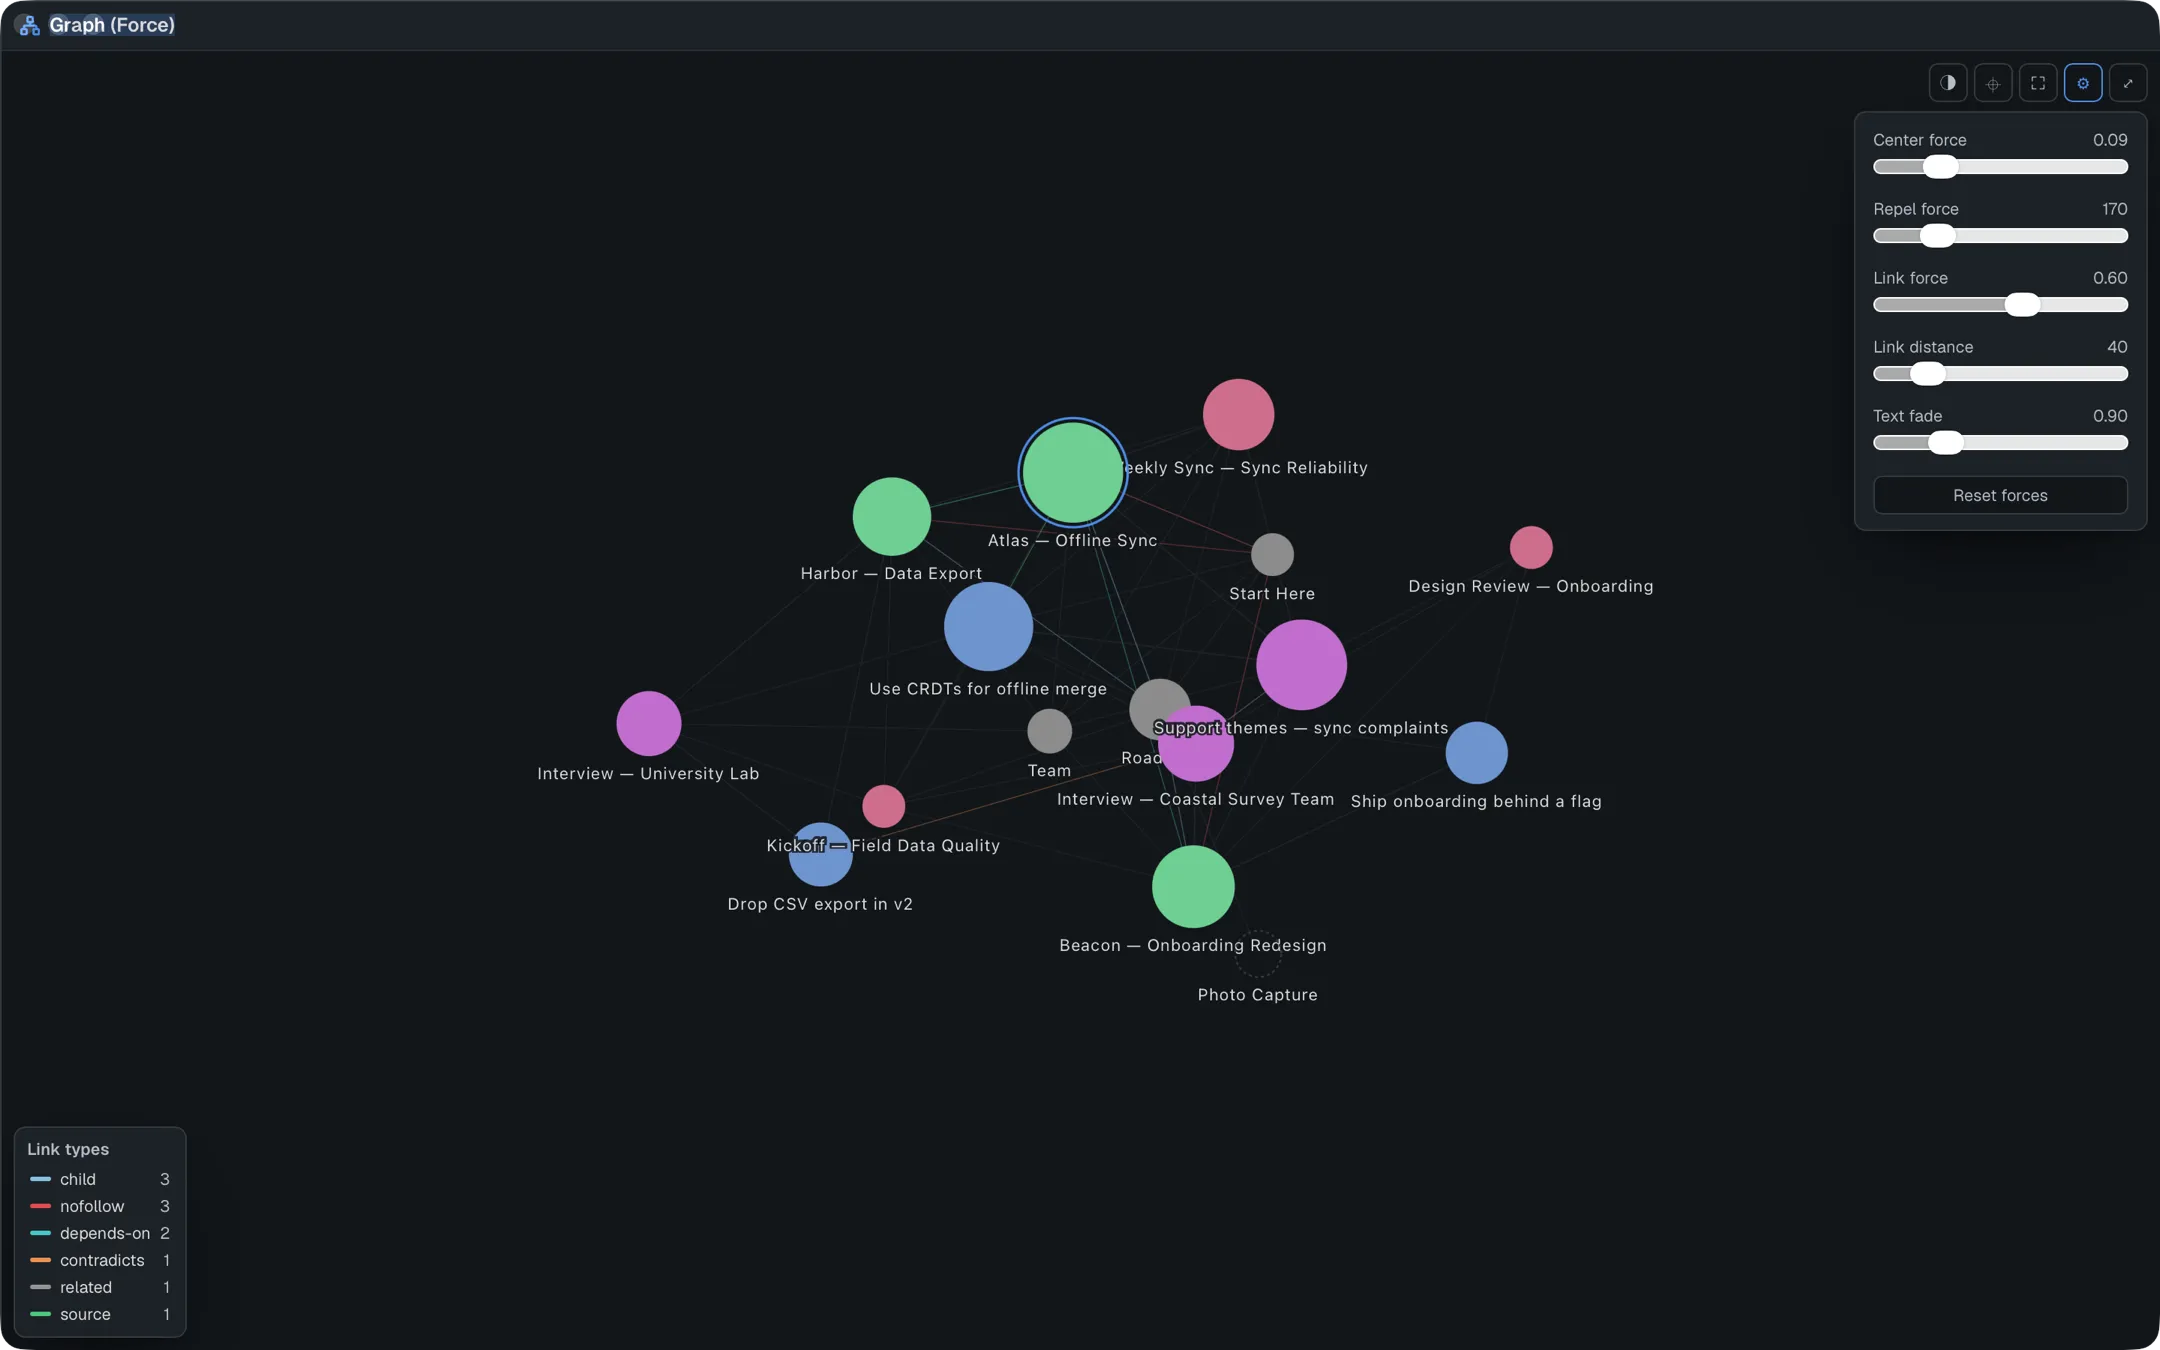
Section titled “Physics”The graph settles itself with a force simulation — nodes repel each other, links pull connected notes together, and everything centers on the panel. The ⚙ button opens five sliders to tune it: center force, repel force, link force, link distance, and how quickly labels fade in as you zoom. Reset forces puts all five back to their defaults. Your settings are remembered per vault. Links between busy notes are given more room, so a dense group opens up instead of collapsing into a ball, and notes with no links sit in a ring around the rest.
The same popover has Size by: Importance (PageRank) (the default), Links in, Links out, File size or Recently changed. Links are counted over what is currently shown.
Drag a node and it moves with your cursor; let go and it rejoins the simulation. Hold Shift as you let go to pin it there instead — a small dot above the node marks it, pins are remembered per vault, and the ⊘ button (shown while anything is pinned) unpins everything. A plain drag of a pinned node releases it. Scroll to zoom, drag empty space to pan. The ⛶ button re-fits and re-centers the whole graph — worth reaching for after you’ve zoomed or panned away and want back to the overview.

Interacting with nodes
Section titled “Interacting with nodes”- Click a node to open that file.
- Hover a node to dim everything outside its immediate connections, so you can trace what it actually touches.
- Shift-click notes to select them (a dashed ring marks each). The chip that appears offers Ask AI about N notes, which opens Chat with those notes attached — the same as the file tree’s Ask AI about this — and Path when exactly two are selected.
- Drag to reposition (Shift-drop pins); maximize (the ⤢ button) expands the panel to the full window for a closer look at a dense vault.
Right-click menu
Section titled “Right-click menu”Right-click for a menu of what you can do with what’s under the pointer:
| On | Items |
|---|---|
| A note | Open, Open in new tab, Show its neighbourhood (local mode around it), Pin here / Unpin, Add to selection / Remove from selection, Ask AI about this note (with AI on), Hide from this view |
| A person, tag or day | Open person / Open tag / Open day, Pin highlight / Release highlight, Hide from this view |
| The background | Fit to panel, Unhide all (N), Clear selection |
The arrow keys move through the items and Enter runs one; Esc closes the menu. Hidden notes stay hidden until Unhide all, and a saved view keeps them hidden. For renaming, moving or deleting a file, use the file tree.
Always live
Section titled “Always live”The graph re-fetches whenever your vault changes: link a note and the edge appears, delete one and any link that pointed at it turns into a broken-link marker until you clean it up. A save that changes nothing the graph draws (editing prose, say) leaves the layout exactly where it was. Changing a property that the graph draws as an edge, or a tags property, updates it too.
A thin bar runs along the top while a slow reload is in progress. If the graph can’t load, a banner says why, with a Retry button.
Limits
Section titled “Limits”The layout is force-directed only — there’s no hierarchical or tree layout, since a linked-notes vault isn’t a strict hierarchy to begin with. Link direction is shown only by small arrowheads (see Which way a link points); for a list of which notes link to one, open it and check the In side of its Links panel. Search matches names, not note contents — for “which notes mention X”, use ⌘K.