Tables, Charts & Queries
Pages in DocGraph aren’t limited to prose. Drop in a typed table, filter it into a saved view, and chart the result — all live data, all embedded in the page next to your writing, all still just a plain HTML file underneath.
These are HTML-only: a .md file can’t hold a live table, query or chart. In a Markdown note, /Table inserts a plain Markdown (GFM) table instead — you can add, remove and reorder its rows and columns, and sort it by a column.
Getting there
Section titled “Getting there”Type / at the start of a line to open the slash menu, then pick one of:
- Data table — a new managed table, or embed one you’ve already built.
- Query — embed a saved query: a filtered view of a table, or of your vault’s own tasks, notes, tags, people and dates.
- HTML table — a portable table whose data lives in the page itself, not a separate store.
- Insert chart — chart a table or a saved query.
No setup or AI configuration is required — this is core app functionality, independent of the local-AI features described in AI Features. The one exception is Extract to table.
Core tasks
Section titled “Core tasks”Insert a table
Section titled “Insert a table”Data table opens a picker to create a new managed table or embed an existing one. A managed table’s rows live in .docgraph/tables/<id>.json in your vault (plain text, so it syncs and diffs cleanly) — the page only ever holds an inert <div data-docgraph-table="id"> marker, which degrades to an empty div if the file is ever opened somewhere that isn’t DocGraph.
To make a table without putting it in a page, type a name in the Tables panel’s New table name… box and press New (or Enter). The table opens in the editor at once; its id is made from the name. Embed it later with Data table.
If you don’t need a reusable, typed table — just a one-off grid of text — HTML table inserts a real <table> whose cells live directly in the page markup. It’s the more portable option, at the cost of types: a cell can hold bold, italic, underline, links and code (⌘B / ⌘I / ⌘U, ⌘L), but never a number, date or relation that queries and charts can use. If you change your mind, you can turn it into a data table.
Import a spreadsheet as tables
Section titled “Import a spreadsheet as tables”Right-click a spreadsheet in the file tree (.xlsx, .xlsm, .xls, .ods or .csv) and choose Import as Table…. DocGraph makes editable copies and leaves the original file alone:
- One table per sheet that has rows, named
<file> — <sheet>(just the file name for a CSV, which has no sheet name). - The first row becomes the column names. A blank header becomes
Column 3and so on, and a repeated name gets a(2)suffix. - Numbers are detected per column. A column whose non-empty cells are all numbers becomes a Number column; anything else is Text. Empty cells stay empty.
- A new page is generated next to the spreadsheet, named after it, with a heading, a line saying where it came from, and an embedded table for each sheet (under a sheet-name heading when there is more than one). It opens as soon as the import finishes.
Later edits happen in the DocGraph tables. They do not flow back to the spreadsheet.
Extract a table from notes (AI)
Section titled “Extract a table from notes (AI)”Right-click a folder and choose Extract to table… to have the AI pull structured rows out of the notes inside it. The item appears only when AI is enabled and the folder contains at least one text note (it is not offered on the vault root). It needs a model picked in Settings → AI; unlike the rest of this page, it is an AI feature.
-
Pick a preset, or Custom…:
Preset Columns Action items Task, Owner, Source Decisions Decision, Date, Who, Source People Name, Role, Source Custom… You write what to extract and a comma-separated list of columns -
Click Extract. The AI reads the notes (at most the first 12, and only the start of each) and returns at most 100 rows.
-
Check the preview grid. Re-extract runs it again; closing the dialog discards it.
-
Click Create table. DocGraph creates a table named after the preset and folder (for example Decisions — projects) and a page in that folder that embeds it, then opens the page. Number columns are detected as in a spreadsheet import.
Nothing is written until Create table, and your source notes are never changed. The result is an ordinary table, so you can edit it freely.
Edit rows and columns
Section titled “Edit rows and columns”A managed table renders as an editable grid right in the page:
-
+ Add row / + Add column buttons at the edges of the table.
-
A column header is editable in place — click to rename it.
-
Hover a row or a column and a grip appears in the left or top gutter. Drag it to reorder, or click it for a menu:
Grip Menu items Row Insert row above, Insert row below, Move up, Move down, Delete row Column Sort ascending, Sort descending, Clear sort (shown once the column is sorted), Insert column left, Insert column right, Move left, Move right, Delete column Move items that have nowhere to go (the first row’s Move up, say) are greyed out. While a table is sorted, the row menu shrinks to a greyed note, Rows are sorted — clear the sort to move them, plus Add row and Delete row, because the sort decides where rows sit. Column menus are unchanged by a sort. On a Markdown table both menus also end with Delete table.
Type and paste into cells
Section titled “Type and paste into cells”- Enter saves a cell, Esc cancels the edit, and Shift+Enter adds a line break in a text column.
- Tab on the last cell adds a row and moves into it, in the page and in the Tables panel.
- Paste from Excel or Google Sheets. Copy a block of cells and paste it into a cell: the grid fills from there, each value typed for its column, and extra rows are added. This works in data tables (in the page and the Tables panel) and in HTML and Markdown tables.
- A web address (
httporhttps) in a text cell shows as a link that opens in your browser. The stored value stays plain text, so queries, sorting and charts are unaffected. - Date cells show dates in the format set in Settings → General → Editor → Dates, while the stored value stays
YYYY-MM-DD. A date column holding a loosely written date (“Oct 5”, “05.10.2026”) shows a → button that stores it as a real date. - Long values wrap and the row grows; a table too wide for the window scrolls sideways inside its own block.
Turn an HTML table into a data table
Section titled “Turn an HTML table into a data table”Paste a range copied from Excel or Google Sheets into an HTML page and DocGraph makes an HTML table, with a bar under it: Make it a data table (⌘↵) or Keep as HTML table. Typing on dismisses the bar. You can also convert any HTML table later: open its grip menu and choose Convert to data table.
The conversion finds the header row, names the table after the heading above it, and gives each column a type from its cells: numbers (“1,200”, “-3.5”), dates, checkboxes (yes/no, ✓), and a dropdown for a column with a few repeated values. A column that doesn’t fit one type stays text, so nothing is lost — currencies and percents (“$12”, “45%”), codes with leading zeros (“007”) and long ids stay text. Bold and italic are not carried over; a link keeps its address.
⌘Z puts the HTML table back and removes the data table it created (unless another page embeds it).
Set a column’s type, formula or relation
Section titled “Set a column’s type, formula or relation”The embedded grid lets you rename columns and edit cells, but a column’s type, relation target, formula and title are set only in the Tables panel editor. Open the Tables panel, click the table, and each column header there has:
- A type dropdown: text, number, boolean, date, select or relation.
- For a relation column, a → pick a table… dropdown listing the other tables. Pick the table whose rows this column should point at.
- For any other column, a ƒ = formula (optional) box. Type a formula such as
[Price] * [Qty]and press Enter or click away to commit. Clearing the box turns the column back into a stored one. See the formula language below. - A ★ title button. It marks this column as the table’s title column, the value shown when another table’s relation column points at a row of this table. Click it again to unset.
- For a select column, an N options ▾ editor: add, rename, remove and reorder (↑/↓) the choices. Renaming an option rewrites the cells that held it; removing one keeps the values already in cells. With no options, the column is free text.
The same header also has a sort button and a trash button that deletes the column, after asking (the prompt says how many rows hold a value). Deleting a row asks first too. Neither can be undone.
Change a table’s id
Section titled “Change a table’s id”Every table has an id — the name of its file in .docgraph/tables/ and the handle that page markers, charts, saved queries, relation columns and the AI use to find it. It sits under the table’s name in the Tables panel editor.
Type a new id and press Enter (or click Change…). Nothing changes yet: DocGraph first works out what the change would touch and lists it — each page whose markers will be rewritten, and how many saved queries and relation columns will be retargeted. Click Change id to go ahead, or Cancel. The id is saved lowercase with hyphens; if yours will be spelled differently, the field shows saves as … first.
There’s no undo. To reverse a change, change the id back.
Delete a table or a query
Section titled “Delete a table or a query”Sort by a column
Section titled “Sort by a column”Hover a column header and a small sort arrow appears at its right edge. Click it to sort ascending, again for descending, and a third time to clear. The column grip’s menu has the same Sort ascending / Sort descending / Clear sort items, for when you would rather not hover. Numbers sort as numbers, dates sort by date, and empty cells always go last.
What a sort does depends on what you are sorting:
- A data table — the sort is a view. The rows keep the order you gave them by dragging, and clearing the sort brings that order straight back. While a table is sorted, its rows can’t be dragged, since the sort decides where they go. Shift-click a second header to sort by it within the first.
- A saved query embedded in a page — clicking a result header changes the query’s own sort, so the builder, the SQL
ORDER BY, and every page that embeds the query all follow. - A plain HTML or Markdown table — there is nowhere to keep a view, so the sort reorders the rows in the file itself. It is an ordinary edit: ⌘Z puts them back. A second click reverses the order.
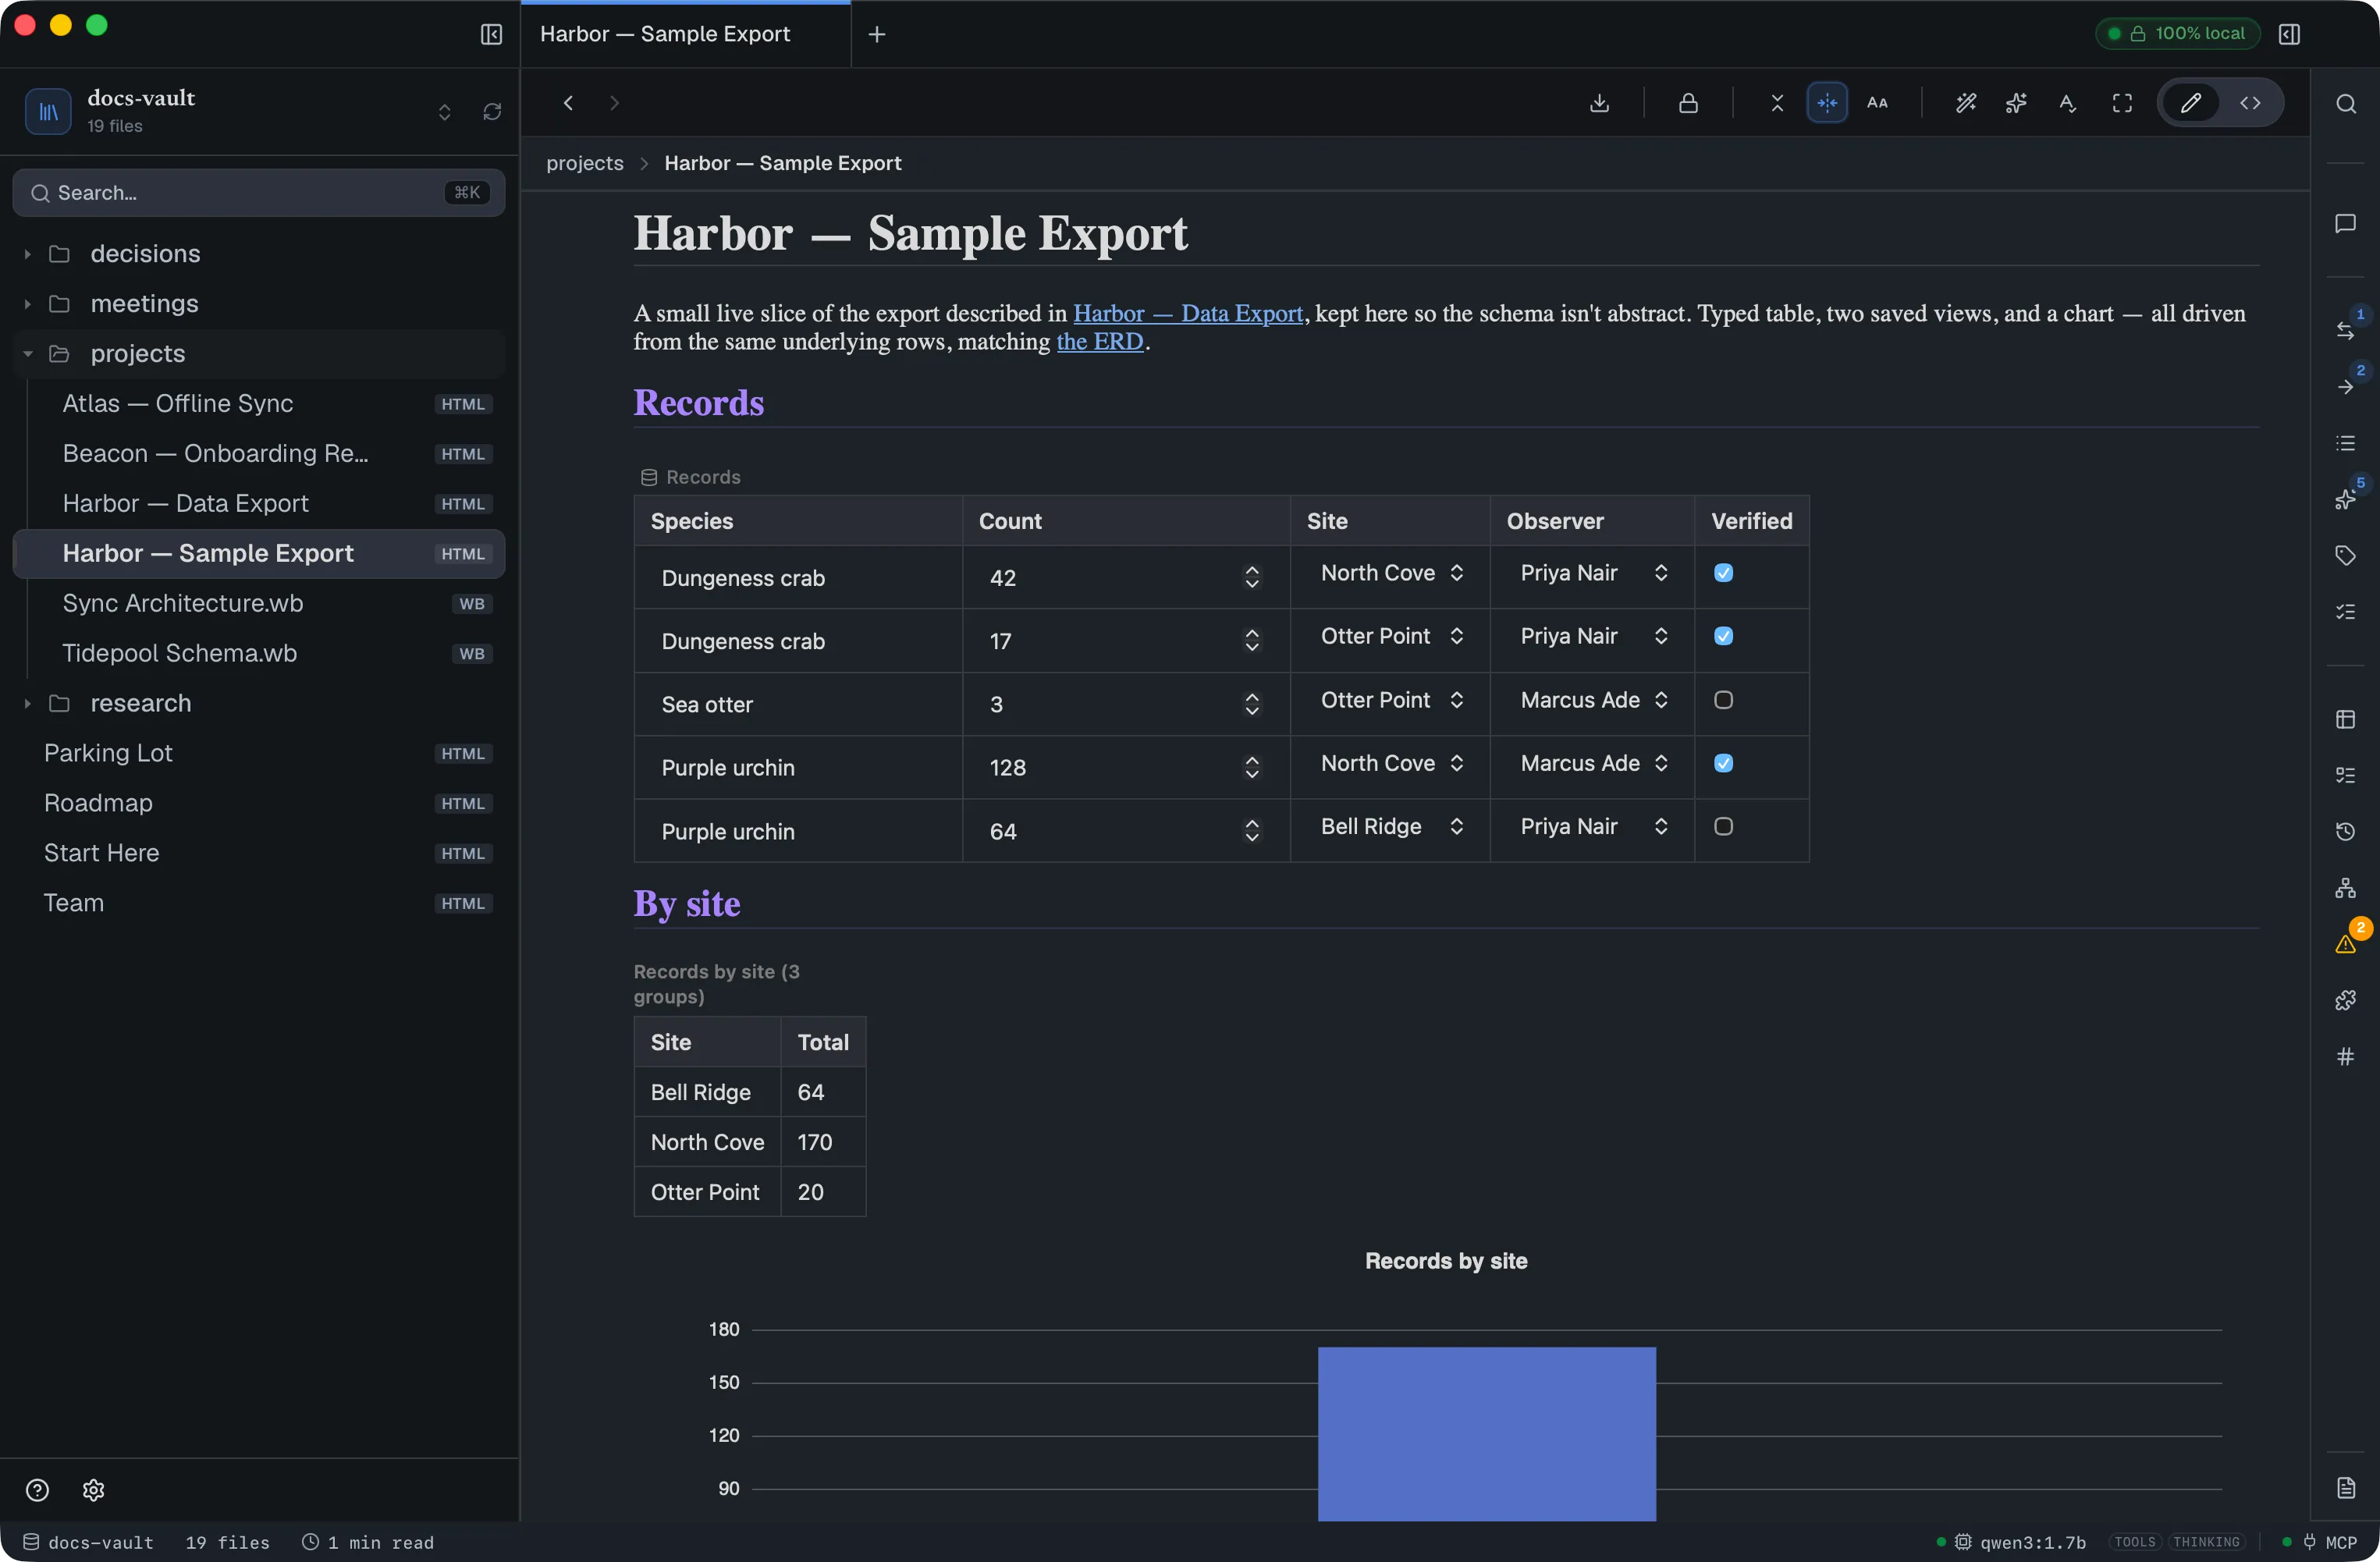
- Cells edit according to their column’s type (see the reference table below) — a Relation column renders as a dropdown of the target table’s rows (shown above: Site and Observer both point at other tables), a Boolean column renders as a checkbox, and a computed column (one with a formula) renders read-only everywhere, including inside saved-query results.
Build a saved query
Section titled “Build a saved query”Open the Tables panel (the table icon in the right sidebar) to see every table and saved query in the vault, and to build a new one:
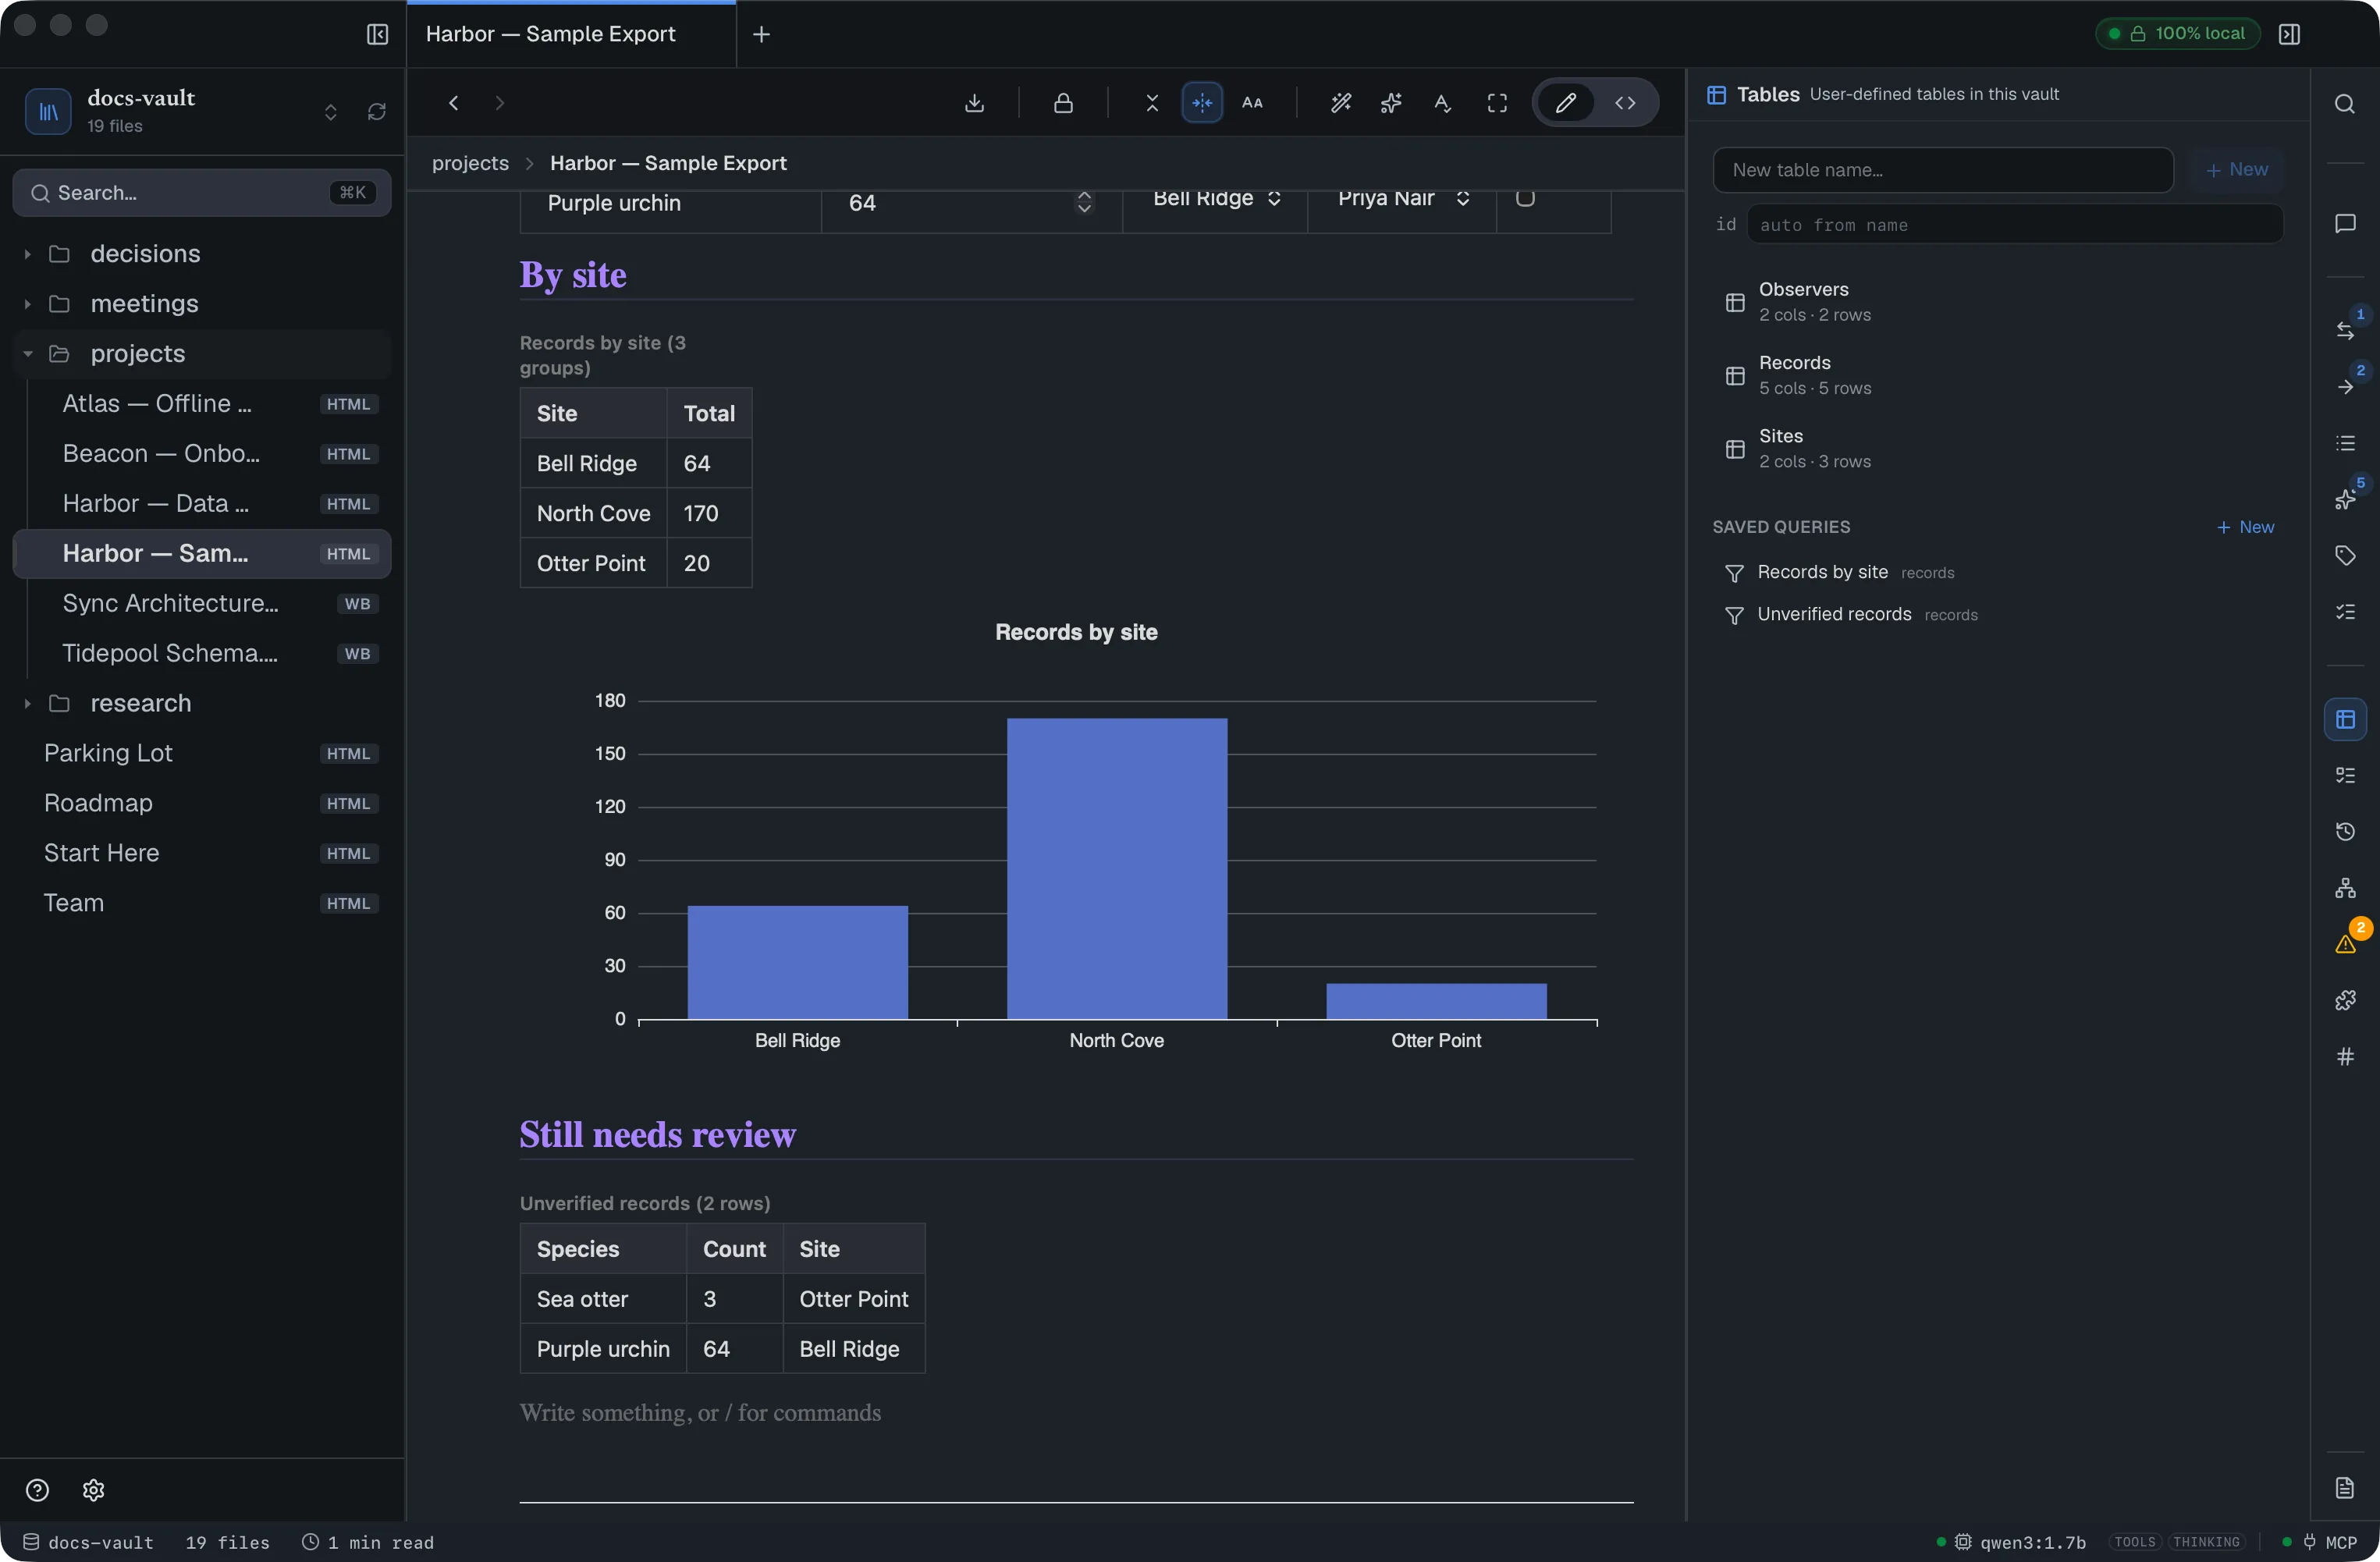
A saved query is a filtered, sorted — and optionally grouped and aggregated — view over one source: a table you built, or your vault’s own data (see below). Its editor has three interchangeable modes:
-
Builder — pick the source, add filter clauses, a sort order, an optional group-by with an aggregate function, and (via a relation column) a joined field from another source. On the Blocks source, Include page defaults lets lines inherit their page’s properties when the query runs (
+pagein filter text does the same). -
Filter text — for vault sources, type the same filter syntax the Todo panel uses (
#launch @sarah is:open due:2026-09-01..2026-09-30) and watch it become ordinary filters you can then edit in the builder. Anything it cannot express says so, by name, rather than narrowing quietly. -
SQL — write the same query as a restricted
SELECT … FROM … WHERE … GROUP BY … ORDER BY … LIMIT …statement. This is a syntax, not raw execution: it compiles to the exact same structured query the builder produces and runs through the same engine — no SQL string is ever run against the database. For example, the “by site” view below is:SELECT Site, SUM(Count) AS Total FROM Records GROUP BY Site
Comparisons are =, <>, <, <=, >, >=, LIKE '%…%' and NOT LIKE '%…%', plus IS NULL / IS NOT NULL for “this field is empty” — all of them available in the builder too.
With more than one filter clause, the builder’s match all / match any switch decides whether a row must pass every clause or just one — AND or OR in SQL, which can’t be mixed in one query. Show columns picks which columns the result shows; with none picked, it shows all of them.
Grouped queries summarise each group with count, sum, avg, min or max — COUNT(*), SUM(col), AVG(col), MIN(col), MAX(col) in SQL. An aggregate needs a GROUP BY.
In SQL, follow a relation column with a dot to pull in a field from the table it points at: SELECT Title, Project.Name AS Proj FROM Tasks, where Project is a relation column of Tasks and Name a column of the table it points to. Relation joins can’t be combined with GROUP BY.
Embed a saved query with data-docgraph-query="id", next to or instead of the table it’s built from — it re-renders automatically whenever the underlying data changes, no reload needed.
Pin a query to the rail
Section titled “Pin a query to the rail”A query you check often doesn’t have to live inside a page. Pin it, and it gets its own tab at the end of the right-hand rail, after Problems:
- Open the Tables panel and click the saved query to open its editor.
- Click Pin as panel next to Save query. The button only appears once the query has been saved.
- A new tab with a filter icon appears on the rail. Its header shows the query’s name and Saved query, pinned to the rail.
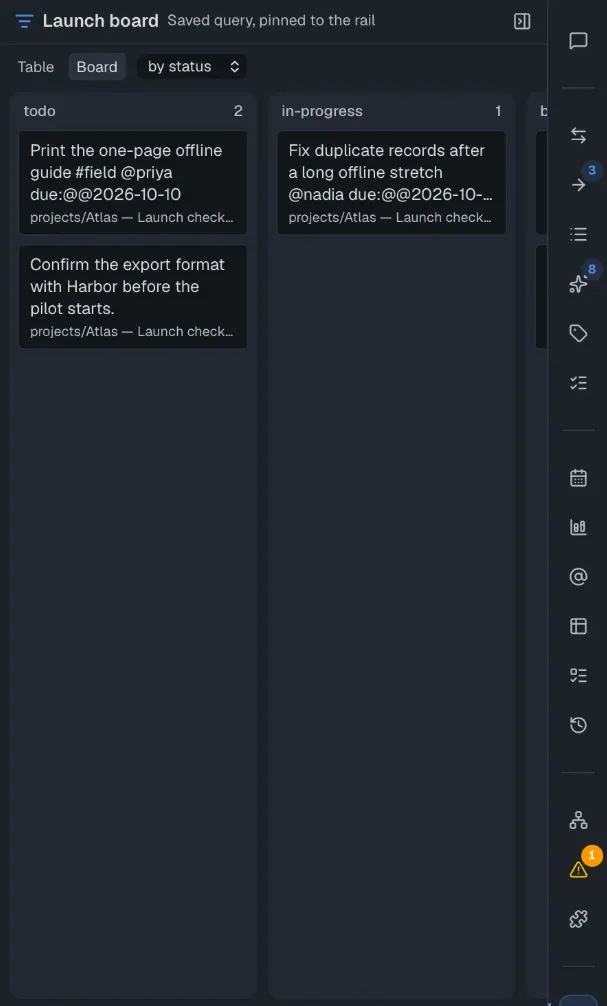
The panel runs the query live, so it updates as your notes change. Click a row to open the note it came from. Renaming the query renames the tab.
Click the small arrow on a column header to sort (▲, ▼, then off); shift-click another header to add it as a second sort key. This sort belongs to the panel only: the saved query and the pages that embed it keep their order. While the two differ, the panel says Sorted in this panel only and offers Save to query, which makes it the query’s own sort (every embed follows), and Reset. The panel remembers its sort per query.
Open as graph shows the query’s rows in the graph. It appears above the results when the rows are notes, and as a button in the query editor for a saved query over your vault’s data. A query over one of your own tables has no notes to draw, so it doesn’t get the button.
A query over tasks or blocks can switch between Table and Board. The board groups items into columns by status or by priority. Dragging a card to another column writes that value into the note, and No value removes it. The panel remembers which view you picked for each query.
To remove the tab, open the query in the Tables panel again and click Pinned to turn it off. Deleting a query removes its tab too.
If the query is gone but its tab isn’t — deleted on another computer that shares the vault, say — the tab says This query no longer exists. Click Remove this tab to close it.
Query your vault, not just your tables
Section titled “Query your vault, not just your tables”A query doesn’t have to be about a table you made. The same editor, the same embed, and the same SQL mode work over the things DocGraph already knows about your vault:
| Source | One row per | Useful for |
|---|---|---|
| Tasks | task item | Everything due next week, across every note — with each todo’s status, priority and estimate |
| Files | note | Recently changed pages in one folder, or the notes the rest of the vault links to most (PageRank, Links in, Links out) |
| Tags | tag on a note | Which notes carry #launch |
| People | @mention | Where someone comes up, and how often. Each row also has the Line the mention is in and that line’s Tags |
| Dates | @@date in prose | What a given day is referred to by |
| Links | link | Broken links, or every link of one type, such as source |
| Properties | page property | Notes where status is active |
| Blocks | line or todo of an HTML page, once per block property | Every line you wrote in a date range, every blocked line, every quote |
| Locked | encrypted file | Counting notes that are encrypted at rest, without reading them |
| Timeline | dated event: an @@date, a due date, a capture or a commit | Activity per week for one person, tag or topic, the data behind the Timeline panel |
| Vault health | problem found in the vault: an orphan note, a broken link, a duplicate title, a suggested tag for an untagged note, a stale AI summary, a typed note missing a required key, a block property using a reserved key, or a contradiction. The checks run in the background after every index update and need no AI model (contradictions need the optional AI job) | One saved query listing everything that needs attention |
| Graph | page a link walk reaches | Everything a project depends on, all the way down; the pages two hops from this one; only the reached notes of one type or folder — see A walk as a table |
| Contradictions | fact two notes state differently, once from each side | Every disagreement with both values and both notes — see When your notes disagree; empty unless Find contradictions is on |
Four things these make possible that a table query cannot:
- Dates that stay relative. A filter can say
@today,@today+7dor@today-30dinstead of a fixed date, so a “due this week” view still means this week a month from now. It is resolved every time the query runs, never frozen when you save it. Add:mdto compare month and day only — thedatessource’s Month-day column equals@today:mdon the same date in any year. - Full-text search combined with everything else. On Files, filtering the Match column runs a full-text search and shows the matching excerpt — so “notes mentioning peregrine, in
field-notes/, changed this month” is a single query. (Match is a search, not a stored column: it is empty until you filter on it, and you cannot ask for notes that don’t contain a word.) - Most linked-to first. Files has PageRank, Links in and Links out. PageRank measures how central a note is to your links:
1.00is an average note,3.40is 3.4 times as central. In the query editor, Most linked-to first (under Sort by, when the source is Files) sorts by it, highest first, so “the ten hub notes inprojects/” is one query. A note embedded in another with/embedor![[Note]]counts as linked from it. The numbers are refreshed a moment after your notes change. - Reaching across sources. Every source carries a Note field pointing at the file it came from, so a task list can show the title of the note each task lives in.
Queries that ask about the page they’re on
Section titled “Queries that ask about the page they’re on”A filter value can refer to the page a query is embedded in, instead of a fixed value:
| Value | Becomes |
|---|---|
@page.title | The page’s <title>, or its file name when it has none. The editor doesn’t show <title>, so a property is usually the better choice |
@page.folder | The folder the page is in |
@page.path | The page’s own path, for example to leave the page itself out of a list |
@page:status | The page’s status property; any property name works |
So one saved query, embedded on many pages, gives each page its own answer. People where Person equals @page:person lists Omar’s mentions (under every spelling of his name) on Omar’s page and Sarah’s on Sarah’s, because each page’s person property holds its name. This is how person pages work.
If the page doesn’t have the property, the value is empty, and a contains filter on it matches nothing, not everything.
A query like this only has an answer inside a note. In the Tables panel’s preview, or when the AI runs it, it shows needs a page rather than an empty result that looks real.
Not everything is expressible. A query combines its clauses with all-AND or all-OR, never a mix, so “assigned to Sarah or assigned by Sarah” needs two queries. Vault sources are read-only views — to change a task, edit the task.
Chart a table or a query
Section titled “Chart a table or a query”Insert chart opens a picker with these fields:
| Field | What it does |
|---|---|
| Data source | Any table, or any saved query, including one over your vault’s tasks or notes. Grouped and aggregated results chart as well as raw rows |
| Chart type | Bar, Line, Area, Pie, Scatter or Gantt (timeline) |
| X axis / Y axis (value) | The category field and the numeric field. The picker pre-selects the first text field and the first number field |
| Series / group by (optional) | Splits the data into one series per value of this field |
| Title | Defaults to the source’s name until you type your own |
| Legend | On by default |
| Stacked | Stacks the series. Offered for Bar and Area charts |
| Unit | A label such as $ shown with values |
| Save as a reusable chart file | Stores the configuration in .docgraph/charts/ so other pages can embed the same chart. Off by default: the settings are written on the chart’s own marker instead |
For a Gantt chart the fields change: Task label (the row name), Start and End (two date fields), and Color by (optional), which colours bars by a field. Y axis is not used.
The chart below is sourced from the grouped “Records by site” query above — the group’s label becomes the x-axis and the aggregate becomes the y-axis:
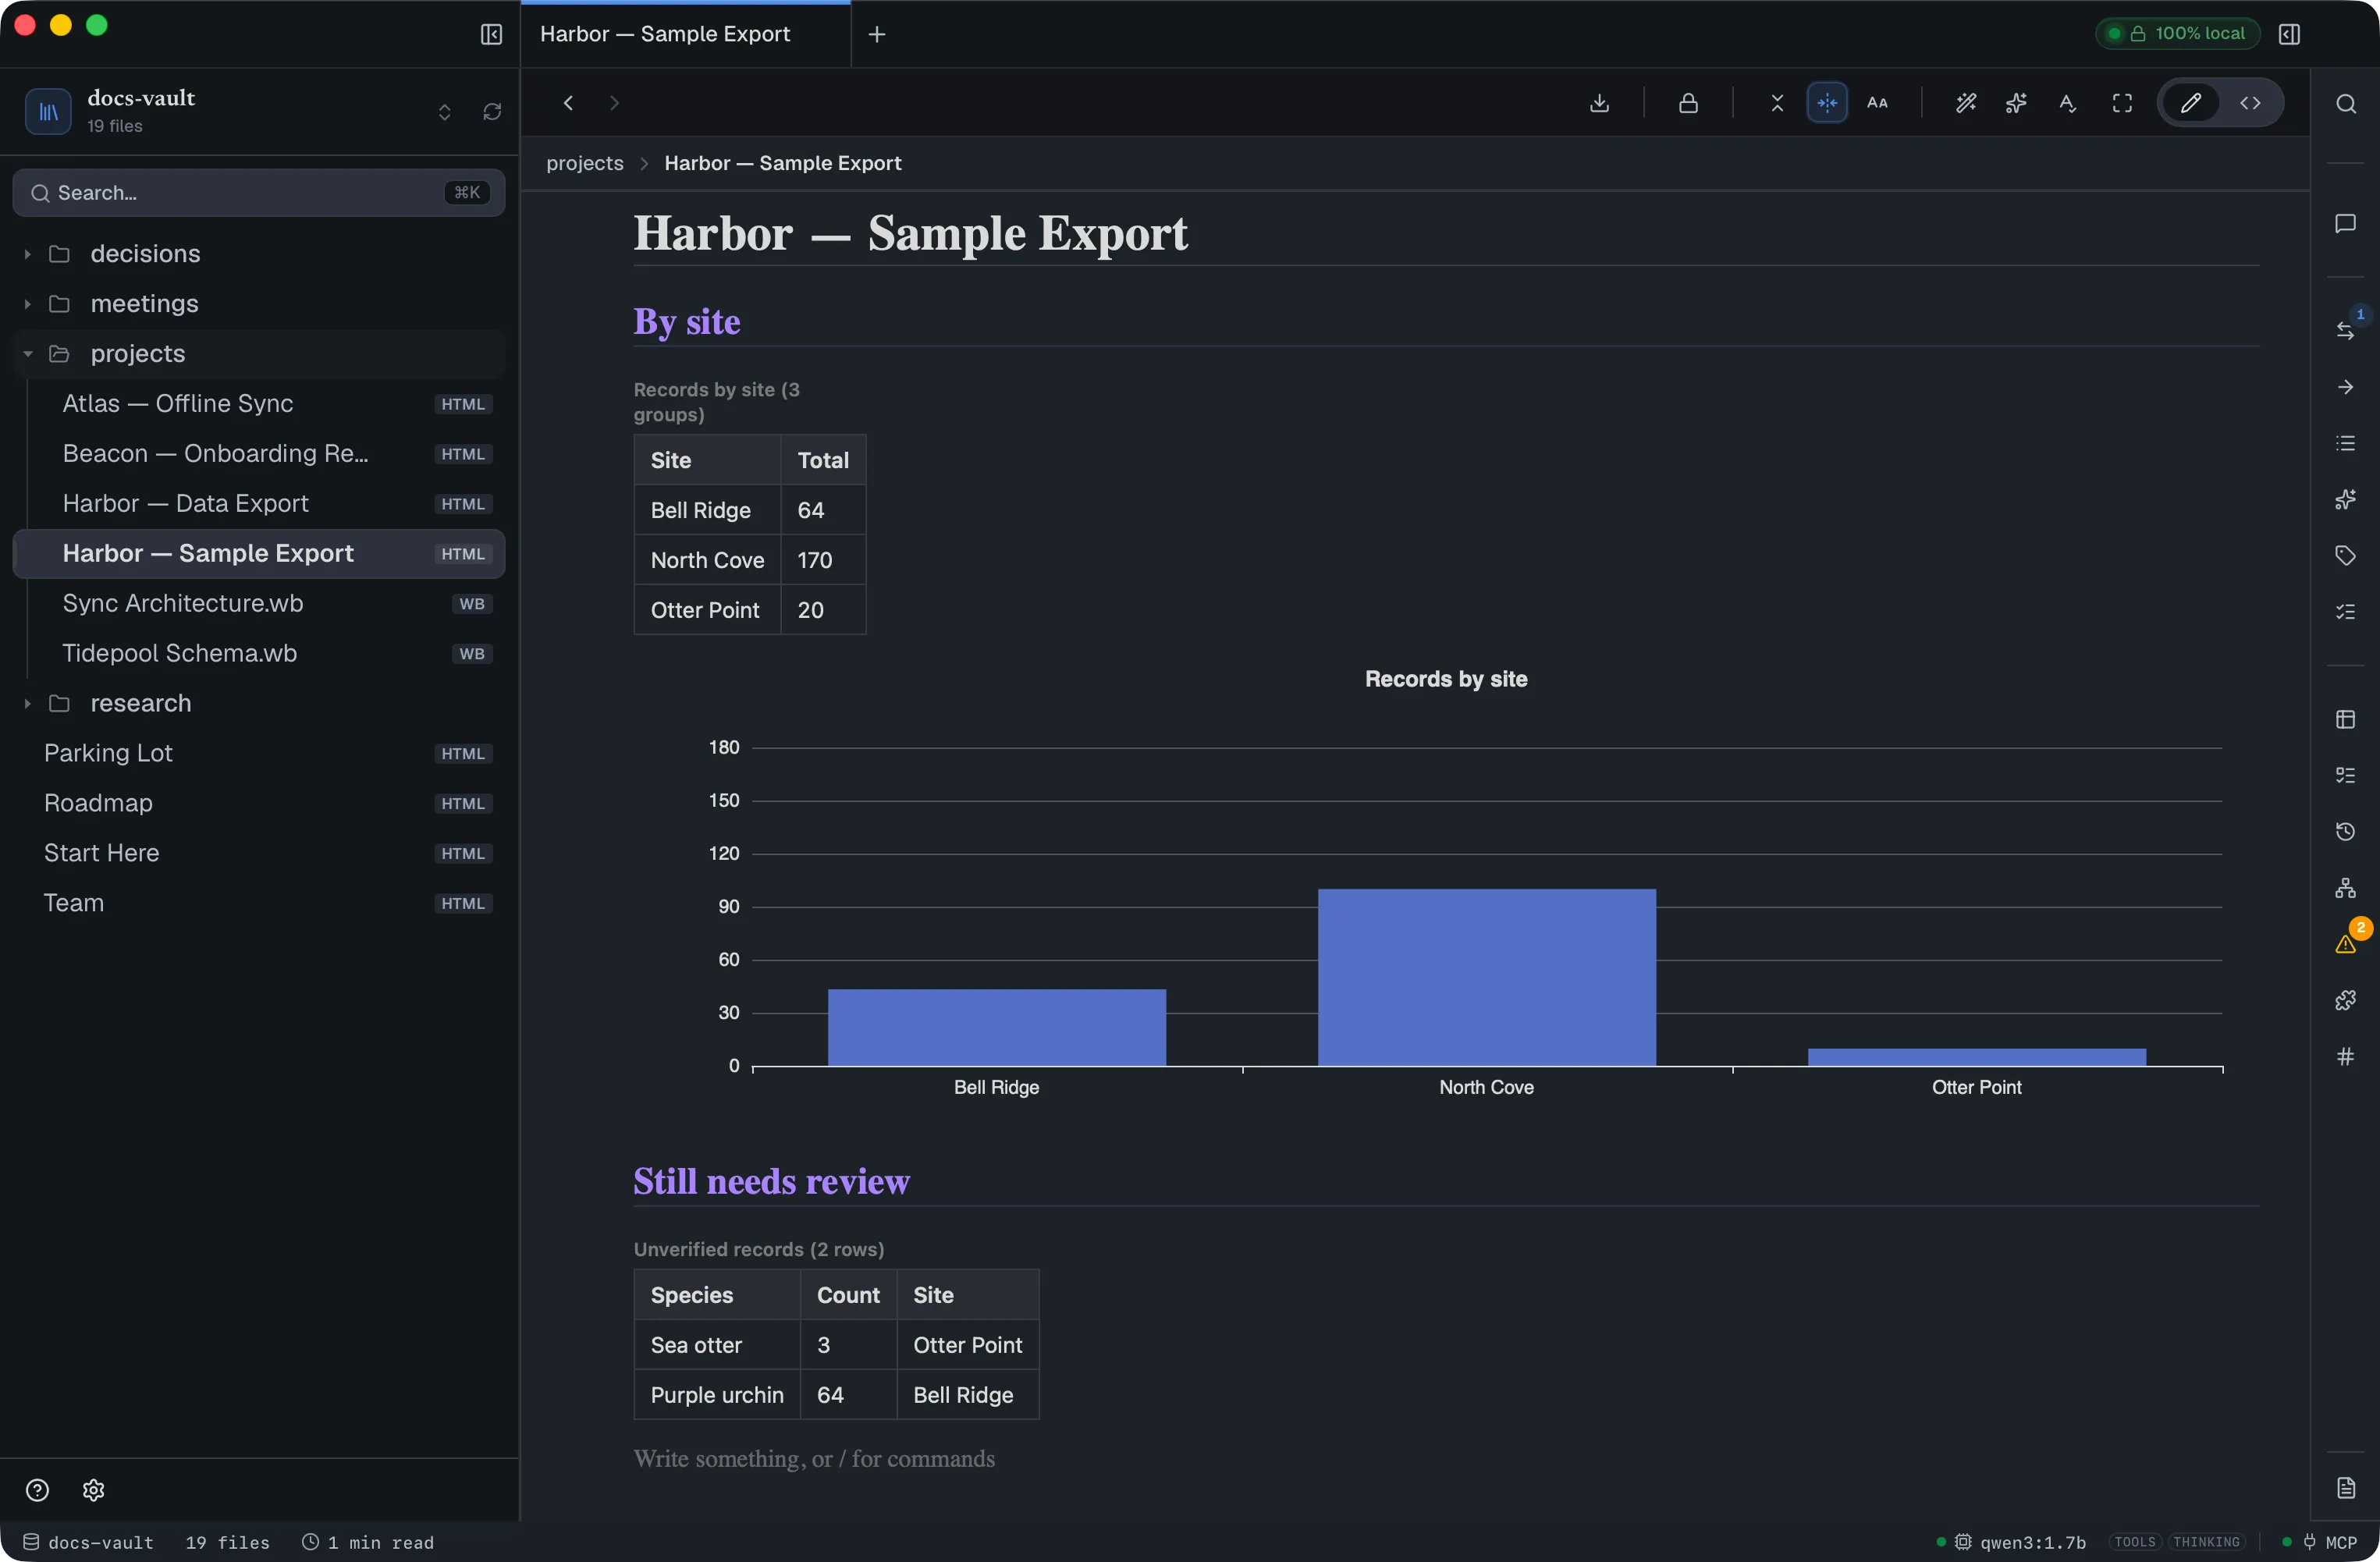
A rendered chart shows a small Edit button on hover (in the editing view only), which reopens the same picker pre-filled with its current configuration — no need to remember what you set the first time.
Everything stays in your files
Section titled “Everything stays in your files”A table or chart marker is inert, plain HTML — <div data-docgraph-table="…">, <div data-docgraph-query="…">, <div data-docgraph-chart="…">. Open the file outside DocGraph and you’ll see an empty div where the widget was; your prose around it is untouched. A chart can also be configured entirely inline, with no separate file, via data-* attributes on its marker — useful for a one-off chart you don’t need to reuse. This is what the picker writes unless you tick Save as a reusable chart file.
Inline chart attributes
Section titled “Inline chart attributes”Four display settings have no control in the picker. You can add them to an inline chart marker by editing the page source (or ask the assistant to):
| Attribute | Effect |
|---|---|
data-animate="false" | Turns off the entry animation. On by default |
data-height="400" | Chart height in pixels. Default 320 |
data-decimals="1" | Number of decimal places shown on values |
data-palette="#5b8ff9,#61ddaa,#f6bd16" | Comma-separated colours, used in order for the series (or the Gantt groups) instead of the default palette |
The attributes the picker does write are data-source (table or query), data-source-id, data-kind, data-x, data-y, data-series, data-start, data-end, data-title, data-stacked, data-legend and data-unit. data-stacked, data-legend and data-animate accept true/false. A marker missing a required one (for example data-y on a bar chart, or data-start and data-end on a Gantt) is rejected rather than drawn.
Ask AI instead
Section titled “Ask AI instead”The chat assistant can read and query your tables directly — list tables, inspect a schema, run a filtered/grouped query, search cell text by keyword, follow a relation to a related row, and read or build charts. Row edits (inserting, updating, deleting a row) and table/query/chart creation are also available to it, gated behind the same confirmation step as any other change it makes to your vault.
Reference
Section titled “Reference”Column types
Section titled “Column types”| Type | Behavior |
|---|---|
| Text | Free text |
| Number | Numeric input |
| Boolean | Checkbox |
| Date | Date input |
| Select | A dropdown of the column’s options, set in the Tables panel editor. A value outside the list shows (not an option). With no options defined, free text |
| Relation | Dropdown of another table’s rows; resolves to that row’s display value everywhere the table is shown |
Any column can additionally be made computed by giving it a formula (e.g. [Price] * [Qty]) instead of stored values — it becomes read-only, and its value is recalculated on every read rather than stored. The type, relation target and formula are set in the Tables panel editor.
Formulas
Section titled “Formulas”A formula is a single expression. It is not SQL and cannot run code or read anything outside the row.
| Part | Syntax |
|---|---|
| Column reference | [Price], by the column’s name (case-insensitive). Renaming a column rewrites the formulas that mention it |
| Literals | Numbers (3, 0.5), text in "double" or 'single' quotes, and true / false |
| Arithmetic | + - * / %, unary -, and parentheses |
| Comparison | == != < <= > >=. A single = is an error. Compared as numbers when both sides look numeric, otherwise as text, so ISO dates (2026-09-01) order correctly |
| Logic | &&, ` |
+ adds only when both sides are numbers. Otherwise it joins the two values as text.
| Function | Result |
|---|---|
if(cond, then, else) | then when cond is true, else else |
concat(a, b, …) | The values joined as text |
round(x) / round(x, digits) | x rounded to a whole number, or to that many decimal places |
abs(x) | Absolute value |
min(a, b, …) / max(a, b, …) | Smallest / largest of the numbers |
today() | Today’s date as YYYY-MM-DD |
days_between(from, to) | Whole days from one YYYY-MM-DD date to the other (negative if to is earlier) |
For example, if([Due] < today(), "late", "ok"), or round([Price] * [Qty], 2).
A formula that cannot be evaluated for a row shows #ERR: … in that cell, with the reason: division by zero, arithmetic needs numbers, not an ISO date: '…' and so on. One bad cell doesn’t blank the rest of the table. The Tables panel editor refuses to save a formula that doesn’t parse, names a column that doesn’t exist, or makes computed columns depend on each other in a loop; if a loop does reach a table, every cell in the looping columns shows #ERR: cycle. A computed column can refer to other computed columns.
Chart types
Section titled “Chart types”Bar, Line, Area, Pie, Scatter, Gantt (timeline). Stacking applies to Bar and Area.
Limits
Section titled “Limits”- Relations point at a single table, one row at a time — there’s no multi-value relation column.
- SQL mode is a restricted single-table dialect, not general SQL: one relation join,
AND-only orOR-only filter groups (not mixed), and the standard aggregate functions. It’s a syntax over the same safe query engine, never raw execution. - A table’s id can be changed from the table’s own editor screen. DocGraph previews how many pages, charts, queries and relations the change will retarget before it commits, and reports any page it could not rewrite rather than swallowing it.
- Conversion goes one way. An HTML table can become a data table (how); there is no way to turn a data table back into an HTML table.